- Guidelines Home
-
Overview:
Nitrogen from non-fertilizer sources- Residual soil nitrate
- Nitrate in irrigation water
- Legume cover crop N credits
- Alfalfa N credits
- Crop residues N credits
- Nitrogen mineralized from soil organic matter
- Manure N credits
- Atmospheric N deposition
Fertilizer use efficiency

Field-Specific Nitrogen Fertilization Adjustments
By Daniel Geisseler and William R. Horwath*
The fertilization guidelines on this website are based on results from studies carried out predominantly in California. However, for an optimal fertilization program, growers need to make field-specific adjustments, which depend on expected yield, soil properties, local weather conditions and crop management (see Fig. 1). These factors affect crop nitrogen (N) uptake, non-fertilizer N inputs and potential N losses. The major factors affecting soil N availability are discussed in the following sections.
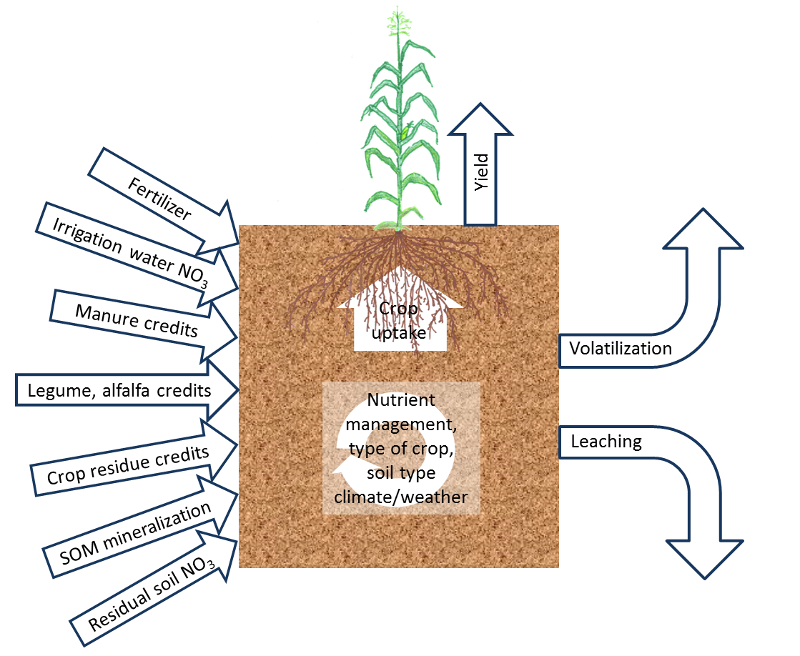
Fig. 1: Overview of the most important site-specific factors affecting crop N availability.
Nitrogen from non-fertilzer sources
When determining the amount on N required, other sources of N need to be taken into account. These sources include soil residual nitrate, nitrate in the irrigation water, and N mineralized during the growing season from organic material, such as soil organic matter, plant residues, manure and compost. Furthermore, a small amount of N is added to fields through atmospheric deposition.
Residual soil nitrate
Soil residual nitrate can be a significant source of crop available N. Nitrate concentrations can be expressed in units of nitrate or nitrate-N. One molecule of nitrate (chemical notation NO3-) is composed of three atoms of oxygen and one atom of N. Therefore, only 22.6% of the nitrate is actually N, which means that, 45 lbs of nitrate contain 10 lbs N. In reports of soil and water analyses, the nitrate or nitrate-N concentration is generally reported in mg/kg or ppm (parts per million).
A nitrate-N concentration of 10 ppm in one foot of the soil profile corresponds to roughly 35 lbs N/acre. Not all the nitrate present in the top foot or two of the profile in spring may be available for plant uptake. Nitrate is very mobile in the soil and can move with the irrigation water below the root zone when water applications exceed evapotranspiration (ET).
Nitrate in irrigation water
Irrigation water, especially well water, may contain N in the form of nitrate. When irrigation water with a high nitrate concentration is used, agronomically significant amounts of N can be added to a field. With one acre-inch of water with a nitrate-N concentration of 10 ppm, 2.27 lbs N/acre are applied to the field. With one acre-foot of the same water, 27.2 lbs N/acre are applied.
As is the case with soil residual nitrate, irrigation water nitrate can move with the infiltrating water below the root zone when water applications exceed ET. This can occur in any type of irrigation system. To account for leaching losses, only the nitrate in the water taken up by crops is generally taken into account. Plant uptake is closely related to ET. Estimates of ET values for different crops, regions and irrigation system and can be found here and here.
Legume cover crop N credits
Microorganisms associated with roots of legumes can fix atmospheric N through a process called biological N fixation. Several methods that do not require a laboratory analysis have been proposed to estimate the N that legume cover crops can add to soil. Both methods calculate the amount of N added through biological N fixation. However, not the entire amount will become available to the next crop. Method 1: In the handbook "Cover Cropping for Vegetable Production", van Horn and coauthors (2011) recommend the following procedure:
- Cut an area of 16 square feet and weigh the sample. The plants should be free of dew. Weigh the sample after removing weeds. The plants should be at the flowering stage, before seed pods have formed.
- Take several 16-ft2 samples from each field to account for variability of the stand in the field.
- Multiply the fresh weight in lbs by the conversion factor in Table 1. The result is the estimated N content of the cover crop in lbs/acre.

Table 1: Conversion factors for different legume cover crops to calculate N content.
| Cover Crop | Conversion factor |
|---|---|
| Bell beans | 10 |
| Sesbania | 10 |
| Sunn Hemp | 11 |
| Blackeyed peas (Cowpeas) | 12 |
| Berseem clover | 13 |
| Woolypod vetch | 16 |
| Purple vetch | 16 |
Method 2: The handbook "Managing Cover Crops Profitably" (Sustainable Agriculture Network, 2007) suggests calculating the dry yield by harvesting a known area and drying the cover crops in the sun for a few consecutive days or in the oven at 140 °F for 24 to 48 hours. The yield can then be calculated using the following equation:
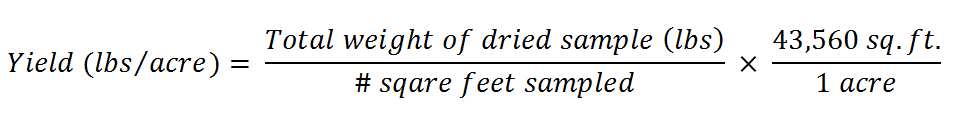
Alternatively, the yield can be estimated by measuring the average height (in inches) of the crop. A 6-inch tall non-woody legume crop that covers the ground completely will contain roughly 2,000 lbs/acre dry matter. For each additional inch, add 150 lbs.
The dry yield can then be multiplied with the N content of annual legumes which is about 3.5-4% N prior to flowering and 3-3.5% N at flowering. As an example, the dry yield of a 10-inch tall crop which does not flower yet yields approximately 2,600 lbs/acre (2,000 lbs for the first six inches and 4 × 150 lbs for the additional inches). With an N content of 3.5-4%, this crop contains between 90 and 105 lbs N/acre.
Alfalfa N credits
Alfalfa can fix large amounts of N. However, most of the fixed N is removed in the harvested forage. Based on an informal survey, Pettygrove and Putnam (2009) recommended that under Central Valley and desert conditions in California, the legume credit should be no more than 60-80 lbs N/acre.
Preliminary result from an ongoing study carried out at three locations across the state indicated that the N credit of alfalfa to wheat harvested as forage may be higher, ranging from 80-150 lbs N/acre (Putnam et al., 2014).
Crop residues N credits
The N content of crop residues strongly affects the amount and timing of N released during the next growing season. The N content is often expressed as the carbon (C) to N ratio of the residues. Generally, residues with a C to N ratio of 20 or less result in net N mineralization. As the C content of most crop residues is between 40 and 45% of the dry mass, a C to N ratio of 20 corresponds roughly to an N content of 2%. Examples are legume residues and residues from vegetables such as lettuce and broccoli. These residues decompose quickly and the N is made plant available by the decomposer community.
In contrast, grain straw (e.g. wheat, barley or rice) and corn stover have a wide C to N ratio and N is released only slowly. When the C to N ratio is wider than approximately 30, soil mineral N may be immobilized by soil microorganisms, temporarily reducing the amount of N available to crops.
Crop residue decomposition is highly influenced by soil moisture, the greatest activity occurring in moist soils during the first two to three months following soil incorporation. Crop residues left on the soil surface decomposes more slowly.
Nitrogen mineralized from soil organic matter
The decomposition and mineralization of soil organic matter can provide significant amounts of plant available N in the form of ammonium, which may be further converted to nitrate, both of which are readily plant available forms of N. However, the timing and amount of N mineralization may not coincide with crop N demand (Gaskell et al., 2006).
Soil organic matter and soil organic N contents are highest in the top foot of the soil profile. As an example, a soil with a soil organic matter content of 2% contains about 3500 lbs N/acre in the top foot of the profile. This value is based on the assumption that pores make up roughly 45% of the soil volume, and an N content of the organic matter of about 5%. Generally 1-3% of soil organic N is mineralized during the growing season (Bremner, 1965). Therefore, as a rough estimate, between 35 and 105 lbs N/acre will become available during the growing season in this soil with 2% soil organic matter. Many other factors also affect N mineralization, most importantly soil temperature, which varies considerably during the year (Figure 2).
Figure 3 illustrates the seasonal differences in N mineralization from soil organic matter, but also the uncertainty of the estimates.
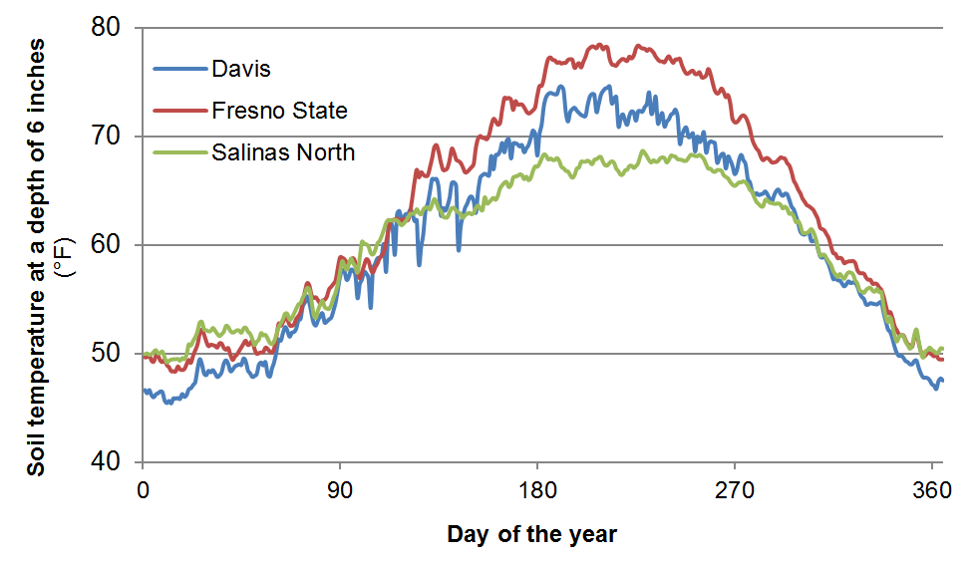
Fig. 2: Annual changes in soil temperature at selected locations in California at a depth of 6 inches (Data source: CIMIS).
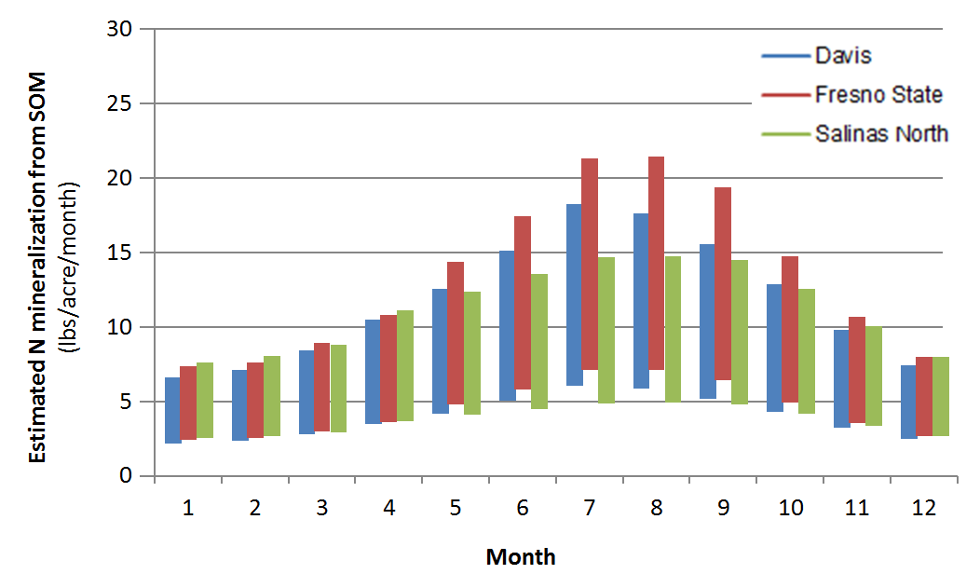
Fig. 3: Estimated monthly N mineralization rates from soil organic matter based on monthly average temperature in a soil with an organic matter content of 2% in the top foot of the profile.
As mentioned above, soil moisture also affects N mineralization. In dry soil, N mineralization is much slower. Therefore, in drip irrigated fields, the amount of N mineralized per acre is reduced, as only part of the soil volume is kept moist.
Manure N credits
Nitrogen in manure occurs mainly in organic forms and as ammonium (Pettygrove et al., 2009). The ammonium is directly available to plants provided it is not lost to the atmosphere in the form of ammonia (see below). Manure ammonium content varies widely depending on the source and its handling. Samples of corral scrapings, composted manure, lagoon sludge and mechanical screen solids taken from dairies in the San Joaquin Valley were found to have an ammonium-N proportion ranging from 0-6% of the total N (Pettygrove, 2009). In poultry manure, ammonium-N may comprise 14-17% of the total N (Gale et al., 2006; Hartz et al., 2000). Ammonium makes up a much higher proportion of lagoon water; Pettygrove (2009) found on average two thirds of the total N was in ammonium form. Lagoon water that is drawn from the bottom of lagoons where more solids are present may have a higher total N content but only about one third of it is in ammonium form (Campbell-Mathews et al., 2001).
The organic forms of N are not directly available to plants, but must be mineralized by soil microorganisms. How quickly organic N is mineralized depends on many factors, such as manure properties, temperature, moisture, placement of the manure and soil related factors. For these reasons it is difficult to predict the amount and time N becomes available to crops (Table 2). Some of the N is integrated into soil organic matter and does not become available during the growing season following its application. Table 2: Estimated availability of organic N in manures (Pettygrove et al., 2009).

From 40-70% of the expected mineralization will occur within the first two months after application, probably closer to 40% for material applied in late fall or winter (Pettygrove et al., 2009; Gale et al., 2006; Andrews and Foster, 2007). Expected lagoon water N mineralization will be slowed if solid particles do not infiltrate into the soil and remain on the surface, which may happen when lagoon water is not sufficiently diluted (Pettygrove, 2009).
Manure applications may contribute to N mineralization for many years. In fields that have been manured continuously for many years, the annual amount of N mineralized from recent and past manure applications may roughly equal the total amount of N added with manure the present year. Therefore, in fields with at least 3-7 years of regular manure additions, the manure application rates can be reduced to the point that total manure N applied is approximately equal to projected crop demand (Chang et al., 2007; Crohn, 2006). However, during periods of high crop N demand, mineral fertilizers or manures with high ammonium concentrations may be added to supplement N mineralization (Pettygrove et al., 2009).
Atmospheric N deposition
Nitrogen is also added to fields through atmospheric deposition. In the Central Valley, total annual N deposition may reach 20 lbs/acre or more. However, this source of N is often not considered for N budget purposes and depends highly on location.
A map for total atmospheric deposition can be found here, which is located on the website of the National Atmospheric Deposition Program.
Fertilizer use efficiency
Leaching losses
Mineral fertilizers contain N in the form of urea, ammonium, nitrate or a mixture of these. These N forms behave differently in soil. Nitrate is very mobile and can easily be leached below the root zone with irrigation water or rain. Time and amount of irrigation water applications, as well as its uniformity across the field strongly affect the risk of nitrate leaching during irrigation events. Urea is relatively mobile in the soil, but is rapidly converted to ammonium. Ammonium is less mobile, but is generally quickly converted to nitrate by soil microorganisms in warm and moist soils. Minimizing leaching losses
- Schedule irrigation based on crop ET to minimize leaching.
- Timing and application rates of N should match the crop's demand (see N uptake curves).
- Split fertilizer applications and apply lagoon water in smaller, more frequent doses. This reduces nitrate concentrations in the soil profile and the time fertilizer N remains in the soil before it is taken up by crops.
- Leach salts when soil nitrate concentrations are low.
- When post-harvest nitrate concentrations are high, plant a non-legume catch-crop, such as triticale or ryegrass.
- Pay attention to the irrigation distribution uniformity.
- Inject the fertilizer into the microsprinkler or drip irrigation system in the middle third of the irrigation set. This prevents urea and nitrate from moving below the root zone but still ensures that the N is distributed well in the wetting zone and does not remain in the irrigation system (Niederholzer, 2011).
Ammonia volatilization
When left on the soil surface, urea and ammonia based fertilizers, and to a lesser degree ammonium fertilizers, are prone to volatilization (Bremner, 1995). The losses may exceed one third of the N applied (Connell et al., 1979; Rochette et al., 2013). The most significant losses occur during the first week or two after application. This is due to the fact that the hydrolysis of urea to ammonium temporarily increases soil pH (Bremner, 1995). Anhydrous ammonia, aqua ammonia and UAN can similarly increase soil pH near the applied fertilizer and result in volatilization.
High soil pH, soil moisture levels below field capacity, high application rates and high temperature increase the risk of ammonia volatilization (Connell et al., 1979; Jones et al., 2007). In contrast, the risk of volatilization is reduced in soils with high clay and organic matter contents. These soils generally have an increased pH buffer capacity and cation exchange capacity. Minimizing ammonia volatilization losses
- Apply fertilizer in a band beneath the surface or incorporate surface applied fertilizer. Research has shown that ammonia volatilization is negligible when urea is incorporated to a depth of 3 inches (Rochette et al., 2013). Incorporation also significantly reduces ammonia losses from manure.
- Apply fertilizer prior to an irrigation event. Applying at least 0.6 inches of irrigation water immediately after urea application has been found to reduce ammonia volatilization by 90% (Holcomb et al., 2011, Sanz-Cobena et al., 2011).
- Use coated fertilizer to slow the rate at which urea granules dissolve. Sulfur and polymer coatings are most commonly used. As an alternative, urease inhibitors can be used to delay the rate of urea hydrolysis (Bremner, 1995).
- Dilute lagoon water. Ammonia losses can be high when lagoon water is applied undiluted or only slightly diluted, and applied before the crop has a full canopy (Chang et al., 2007).
Denitrification
Denitrification is the reduction of nitrate to nitrous oxide (N2O) or dinitrogen (N2) by soil microorganisms. Nitrous oxide and dinitrogen are gases and are lost to the atmosphere. The denitrification rate depends on soil water saturation, soil nitrate concentration, soluble organic C availability and temperature (Rolston et al., 1982). The denitrification rate is increased in wet or compacted soil when the proportion of soil pores filled with water increases above 60-70% and aeration is reduced (Dalal et al., 2003). High nitrate concentrations, high temperatures and the availability of C from manure, crop residues, or root exudates also increase denitrification rates.
Rolston and coworkers (1982) studied the influence of irrigation frequency and incorporation of crop residue on denitrification losses in a Yolo loam at Davis. Total denitrification losses ranged from 0.7 to 5% of the nitrate fertilizer applied (Rolston et al., 1978). More frequent low-volume irrigations tended to lower losses, while the availability of carbon from incorporated straw increased losses. However, when the soil moisture was constantly above field capacity, denitrification losses from plots cropped with ryegrass reached 14% during the summer. Under the same conditions, losses exceeded 70% of the applied nitrate-N in a manure amended plot (Rolston et al., 1978). In contrast, very little denitrification occurred in the same soils during the cooler winter months and when soil moisture was below field capacity. Minimizing denitrification losses
- In flooded rice systems, nitrate is quickly reduced and lost to the atmosphere (Linquist et al., 2012). To prevent denitrification losses, do not use nitrate containing fertilizers. In addition, when fields are drained mid-season, keep the drained period short; as N mineralization and nitrification will take place once the soils are aerated.
- Use of subsurface drip systems significantly reduces denitrification losses. Sprinkler irrigation also reduces denitrification losses.
- Keep soil nitrate concentrations low by matching N supply with demand. Specific management practices include splitting N applications and improved timing of N applications, taking residual soil nitrate and other non-fertilizer N sources into account and avoiding applying N in excess of crop demand.
- If fertilizers need to be added well before crops can take N up, nitrification inhibitors and controlled release fertilizers can keep the nitrate concentration in the soil low (Decock, 2014).
References
- Andrews, N., Foster, J., 2007. User guide: Organic fertilizer calculator. EM 8936-E. Oregon State University. Corvallis, OR.
- Bremner, 1965. Methods of Soil Analysis. pp. 1324-1345.
- Bremner, J.M., 1995. Recent research on problems in the use of urea as a nitrogen fertilizer. Fertilizer Research 42, 321-329.
- Campbell Mathews, M., Frate, C., Harter, T., Sather, S., 2001. Lagoon water composition, sampling and field analysis. In: Globalization & California Agriculture: How Will We Compete? Proceedings of the 2001 California Plant and Soil Conference, Fresno, CA.
- Chang, A., Harter, T., Letey, J., Meyer, D., Meyer, R.D., Campbell-Mathews, M., Mitloehner, F., Pettygrove, S., Robinson, P., Zhang, R., 2007. Managing dairy manure in the Central Valley of California. Publication 9004, Division of Agriculture and Natural Resources. University of California. Oakland, CA.
- Connell, J.H., Meyer, R.D., Meyer, J.L., Carlson, R.M., 1979. Gaseous ammonia losses following nitrogen fertilization. California Agriculture 33(1), 11-12.
- Crohn, D.M., 2006. Optimizing organic fertilizer applications under steady-state conditions. Journal of Environmental Quality 35, 658-669.
- Dalal, R.C., Wang, W., Robertson, G.P., Parton, W.J., 2003. Nitrous oxide emissions from Australian agricultural lands and mitigation options: A review. Australian Journal of Soil Research 41, 165-195.
- Decock, C., 2014. Mitigating nitrous oxide emissions from corn cropping systems in the Midwestern U.S.: Potential and data gaps. Environmental Science & Technology 48, 4247-4256.
- Gale, E.S., Sullivan, D.M., Cogger, C.G., Bary, A.I., Hemphill, D.D., Myrhe, E.A., 2006. Estimating plant-available nitrogen release from manures, composts and specialty products. Journal of Environmental Quality 35, 2321-2332.
- Gaskell, M., Smith, R., Mitchell, J., Koike, S.T., Fouche, C., Hartz, T., Horwath, W., Jackson, L., 2006. Soil fertility management for organic crops. Vegetable Information Center. University of California, Davis.
- Hartz, T.K., Mitchell, J.P., Giannini, C., 2000. Nitrogen and carbon mineralization dynamics of manures and composts. HortScience 35, 209-212.
- Holcomb, J.C., Sullivan, D.M., Horneck, D.A., Clough, G.H., 2011. Effect of irrigation rate on ammonia volatilization. Soil Science Society of America Journal 75, 2341-2347.
- Jones, C.A., Koenig, R.T., Ellsworth, J.W., Brown, B.D., Jackson, G.D., 2007. Management of urea fertilzer to minimize volatilization. Montana State University Extension Service Publication EB173.
- Linquist, B.A., Adviento-Borbe, M.A., Pittelkow, C.M., van Kessel, C., van Groenigen, K.J., 2012. Fertilizer management practices and greenhouse gas emissions from rice systems: A quantitative review and analysis. Field Crops Research 135, 10-21.
- Niederholzer, F., 2011. Using urea efficiently.
- Pettygrove, G.S., Putnam, D.H., 2009. Legume N credit for crops following alfalfa. Manure Technical Bulletin Series. University of California Cooperative Extension.
- Pettygrove, G.S., Heinrich, A.L., Crohn, D.M., 2009. Manure nitrogen mineralization. Manure Technical Bulletin Series. University of California Cooperative Extension.
- Pettygrove, 2009. Dairy manure nutrient content and forms. Manure Technical Bulletin Series. University of California Cooperative Extension.
- Putnam, D.H., Li, E.F., Pettygrove, S., Orloff, S., Lundy, M., 2014. Characterizing N fertilizer requirements of crops following alfalfa. Presentation held at the 22nd Annual FREP Conference in Modesto, October 29-30.
- Rochette, P., Angers, D.A., Chantigny, M.H., Gasser, M.O., MacDonald, J.D., Pelster, D.E., Bertrand, N., 2013. Ammonia volatilization and nitrogen retention: How deep to incorporate urea? Journal of Environmental Quality 42, 1635-1642.
- Rolston, D.E., Hoffman, D.L., Toy, D.W., 1978. Field measurement of denitrification: I. Flux of N2 and N2O. Soil Science Society of America Journal 42, 863-869.
- Rolston, D.E., Sharpley, A.N., Toy, D.W., Broadbent, F.E., 1982. Field measurement of denitrification: III. Rates during irrigation cycles. Soil Science Society of America Journal 46, 289-296.
- Sanz-Cobena, A., Misselbrook, T., Camp, V., Vallejo, A., 2011. Effect of water addition and the urease inhibitor NBPT on the abatement of ammonia emission from surface applied urea. Atmospheric Environment 45, 1517-1524.
- Sustainable Agriculture Network, 2007. Managing cover crops profitably. 3rd edition. Sustainable Agriculture Network, Beltsville, MD.
- van Horn, M., Brennan, E. Daugovish, O., Mitchell, J., 2011. Cover crop management. In: Cover cropping for vegetable production. A grower's handbook. University of California Agriculture and Natural Resources Publication 3517.
* Daniel Geisseler is an Extension Specialist in the Department of Land, Air and Water Resources at the University of California, Davis. Patricia Lazicki is an Assistant Specialist in the Department of Land, Air and Water Resources at the University of California, Davis. William R. Horwath is professor of Soils and Biogeochemistry in the Department of Land, Air and Water Resources and the James G. Boswell Endowed Chair in Soil Science at the University of California, Davis.