| |

|

|

|
|
|
|
| Preplant | Sowing Growth | Seedling | Early Bud | Bloom | Established Stand |
|
Nitrogen (N)
|
Soil Test
|
|
| |
Starter N
|
N to Established Alfalfa
|
|
Nitrogen (N)
Soil Test
Starter N
N to Established Alfalfa
|
Close
Alfalfa Nitrogen Nutrition
Deficiency Symptoms
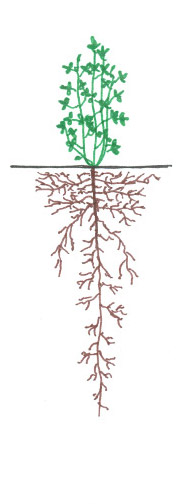
Nitrogen deficient plants are stunted and leaves are yellowish [N12]. Nitrogen deficiency symptoms are evident soon after planting when seedlings reach 4-8 inches in height. Nitrogen deficiency is the result of poor inoculation with Rhizobia bacteria. Deficient plants are scattered among taller, dark green plants.
Excessive Nitrogen
High soil N levels may reduce N fixation by Rhizobia in the root nodules [N1, N4].
Close
Soil Nitrate Test
A soil nitrate test before planting can be used to determine whether a small starter N application may be beneficial (see Starter N). For more information on sampling procedure see Sampling for Soil Nitrate Determination.
Close
Starter Nitrogen
Nitrogen fertilizer applications at planting are generally not recommended as they are rarely economic, can encourage weed growth and may delay nodulation.
After planting, N-fixing nodules may require several weeks to develop and N fixation before the first cut is generally low. During this time, the seedlings benefit from soil and fertilizer N [N1, N2, N5, N6]. Typically, however, residual soil N is sufficient to supply the N needed before significant N fixation occurs. Under very cold conditions, in soils depleted in N or under stressed conditions, small amounts of N applied as starter may aid seedling establishment. In addition, N applied in a band together with P can increase P uptake [N8].
A starter application of 20-40 lbs N/acre may be beneficial when the residual nitrate concentration is below 3-4 ppm NO3-N (15 ppm NO3) [N3, N7]. Applications of larger amounts of N, however, may inhibit bacterial colonization of the root system and reduce N fixation [N1, N3, N7].
A common fertilizer applied at planting is monoammonium phosphate (MAP, 11-52-0) [N1].
With the proper Rhizobia bacteria in the soil, alfalfa can fix nitrogen from the air. Alfalfa should be inoculated if there is no recent history (10 years) of alfalfa in a field. Even with a field that had alfalfa relatively recently, applying commercial Rhizobia to seed is a way to assure that the bacteria is present in the field during establishment [N10, N11].
Growers may purchase inoculum and apply it to the seed before planting, or buy inoculated seed [N10, N11].
- Buy only inoculum that is recommended for alfalfa.
- Check the seal of the package and the expiration date.
- Apply the inoculum following the instructions on the package.
- Store inoculum in a cool, dry place, preferably a refrigerator.
- Pre-inoculated seed should be re-inoculated before planting if inoculated more than 6 months ago.
It is important to plant alfalfa at the proper time of year for successful stand establishment and root nodulation. The ideal planting time is mid-September in the Sacramento Valley to early October in the San Joaquin and Imperial Valleys. In the Intermountain Region, the optimum planting window is typically from the second to the last week of August depending on the elevation and the growing area. If crop rotations don't allow early planting, it is often better to wait until early February to plant and avoid trying to establish the crop during the coldest months of the winter [N10, N11].
Close
Nitrogen to Established Alfalfa
Alfalfa obtains N from the atmosphere through a symbiotic relationship with bacteria (Rhizobia) in the root nodules. Therefore, N fertilization of alfalfa is seldom beneficial or profitable [N3, N4, N9].
In general, N applications after stand establishment are only effective when nodulation and N fixation are restricted [N8]. Situations where N fixation may not be adequate include low soil pH (<6.3), waterlogged or compacted soils, cold conditions, extremely shallow root zone as well as molybdenum and cobalt deficiency. Furthermore, in fields without a history of alfalfa production, nodule formation may be insufficient [N9]. In all these cases, correcting the limiting soil factor and re-inoculating the field with water-run inoculum applications to re-establish nodules may be more efficient than N fertilization [N1].
|
| Preplant | Sowing Growth | Seedling | Early Bud | Bloom | Established Stand |
|
Phosphorus (P2O5)
|
Soil Test
|
|
Tissue Analysis
|
| |
Starter P
|
|
Foliar P
|
|
P Fertilization
|
|
Phosphorus (P2O5)
Soil Test
Tissue Analysis
Starter P
Foliar P
P Fertilization
|
Close
Alfalfa Phosphorus Nutrition
Deficiency Symptoms
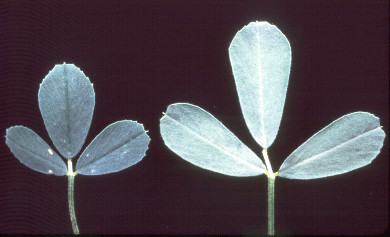
Phosphorus deficient plants are stunted with small leaves. Leaves may turn dark blue-green [P18]. Leaflets may fold together and the undersides and stems may turn red or purplish [P32].
Small deficient alfalfa leaflet on the left compared with healthy leaflet on the right (photo provided by the International Plant Nutrition Institute).
Adequate P availability has a positive effect on the number of Rhizobia nodules, resulting in larger nodule size and greater N fixation [P1].
Close
Soil Analysis
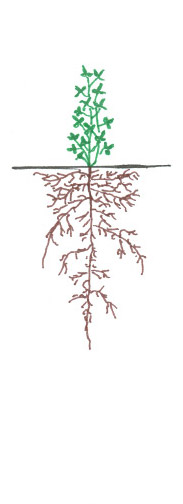
Soil tests are most useful for assessing nutrient availability prior to planting [P18]. If soil tests are taken in established stands, sampling may be repeated every 2 to 3 years [P7]. The tap root of alfalfa may grow to a depth of 9 feet or deeper [P33]. However, the root density is highest in the top 6-8 inches of the profile and more than half the total root mass is located in this layer [P10, P27].
Soil P availability is generally determined on samples taken from the top 6-12 inches of the profile [P7, P18].
The sample must be representative of the field it is taken from. Distinctly different areas should be sampled separately. A total of 15-20 cores from each field or unit should be taken and mixed thoroughly [P18]. Organic debris and plant material should be removed [P7]. A composite sample of about a pint in size from each field is placed in a double-thick paper bag and dried immediately at room temperature before being mailed to the laboratory [P15]. See Soil Test Sampling for more detailed sampling instructions.
In acidic and alkaline soils, P availability is greatly reduced. Under these conditions, soil P availability is better increased by adjusting soil pH than by applying large amounts of P fertilizer.
Soil variability within a field can be addressed by establishing benchmark sites or by grid sampling.
For benchmark sites, a field is divided into three areas where, based on previous crops, alfalfa growth is good, medium and poor. Within each area, permanent benchmark locations of approximately 50 x 50 feet in size are established. Permanent benchmark locations that are sampled each time allow monitoring field variability and historic trends in nutrient availability [P7, P15, P17].
Variability within a field can also be assessed by grid sampling. A study carried out in five alfalfa fields located in Los Angeles and Siskiyou Counties showed that fertilizer costs can be reduced by applying variable rates based on sampling densities of one sample per 3 to 6 acres [P2].
In most western states, the available soil P is determined by extracting soil samples with a bicarbonate solution (Olsen-P test) [P7].
An economic yield response to fertilizer application is likely when the soil is deficient, somewhat likely for values in the critical range and unlikely for values above the adequate level (see Table) [P15].
Interpretation of soil test results for alfalfa production [P18].
Response
Category |
Phosphorus
bicarbonate
extract (ppm) |
Potassium
ammonium
acetate (ppm) |
| Deficient |
<5 |
<40 |
| Critical |
5-10 |
50-80 |
| Adequate |
10-20 |
80-125 |
| High |
>20 |
>125 |
Close
Tissue Analysis
Plant tissue tests are useful in monitoring the P and K status of alfalfa and evaluating the effectiveness of current fertilization practices [P17]. Plant tissue should be sampled every year [P7]. To evaluate the P status of alfalfa after P fertilization, samples should not be taken within 60 to 90 days of P application [P17, P18].
Traditionally, tissue P and K have been determined on the stems of the middle third of plants. Recent research has shown that bale core samples may be used to determine P and K status of alfalfa. Both methods are described below.
Sampling instructions and sample handling [P17, P26]:
- Samples can be collected at any cutting. The first cutting is preferred for sulfur analysis. However, in non-dormant areas, the first cutting should be avoided for P and K analysis because of uneven spring growth [P28].
- Sample when the alfalfa is at the 10% bloom stage.
- Collect 40 to 60 stems from at least 30 plants.
- Cut stems into three sections of equal length (see Figure).
- Discard the bottom third.
- Place the top third in one paper bag and the middle third in another.
- Dry the samples.
- Separate leaves from stems in middle third by rubbing between hands.
- Put leaves in one bag and stems in another bag.
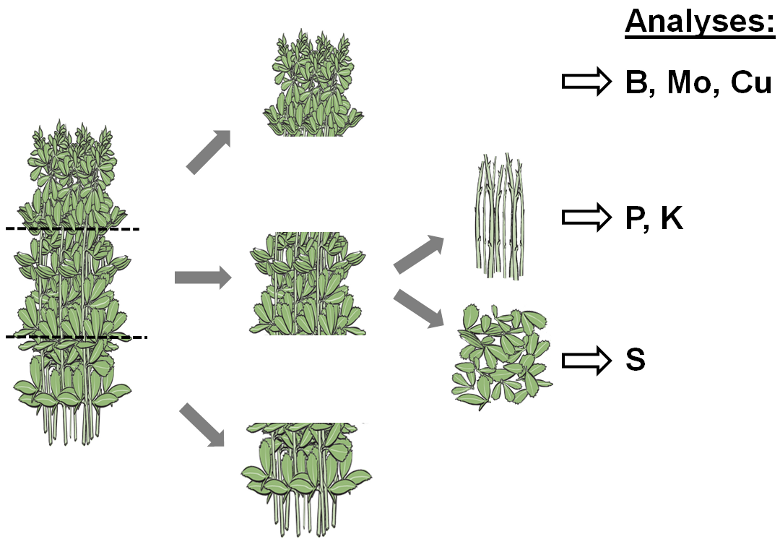
- Analyze stems from the middle third for phosphorus (PO4-P) and potassium (K). Analyze top third sample for boron (B), molybdenum (Mo), and copper (Cu). Use the leaves from the middle third for sulfur (SO4-S) analysis.
Traditional sample handling procedure for alfalfa tissue nutrient analysis.
Interpretation of test results for alfalfa midstem samples taken at 10% bloom stage [P16].
Response
Category |
Phosphorus
(ppm PO4-P) |
Potassium
(% total K) |
| Deficient |
<500 |
<0.65 |
| Critical |
500-800 |
0.65-0.80 |
| Adequate |
800-1500 |
0.80-1.50 |
| High |
>1500 |
>1.50 |
When samples are taken at an earlier stage, the values reported in the table are higher. At mid-bud and very early bud stage, the P concentration should be 1,200 and 1,600 ppm, respectively [P18]. Results from a study in grower’s fields in the Sacramento Valley indicated lower limits of the adequate levels of 2000, 1500, 1000 ppm at mid-bud, late-bud and early flower stage, respectively [P28]. An economic yield response to fertilizer application is very likely for values below the deficient level, somewhat likely for values in the critical level, and unlikely for values over the adequate level [P17].
Instructions for representative bale core sampling [P24]:
- Take a separate composite sample from each lot of hay. Lots must be from the same cutting, variety, field, stage of maturity and harvested within 48 hours. A lot must not exceed 150-200 tons.
- Use a good, sharp coring device with an inner diameter of 3/8 to 5/8 inch. An open auger or corkscrew type device should not be used.
- Take samples from random bales at various heights.
- Take one core from a minimum of 20 bales per lot. Take 20-40 cores in larger or variable lots.
- Probe the ends of bales near the center, and at least 12-18 inches into the bale. Probe should be at right angles to the bale end.
- Combine cored samples into a single sample and store it in a sealed polyethylene freezer bag. Do not expose to heat or direct sun.
- The sample should weigh about 0.5 lb.
- Send to the lab as soon as possible.
Interpretation of whole plant samples collected from baled hay taken at 10% bloom stage [P18].
Response
Category |
Phosphorus
(%) |
Potassium
(%) |
| Deficient |
<0.20 |
<0.8 |
| Critical |
0.21-0.22 |
0.81-1.09 |
| Adequate |
0.23-0.30 |
1.10-1.40 |
| High |
>0.30 |
1.40-3.00 |
At mid-bud and very early bud stage, the P concentration should be 0.28 and 0.26%, respectively [P18].
Current guidelines are based on alfalfa nutrient concentrations at 10% bloom growth stage. However, to produce highly digestible alfalfa for the dairy industry, growers harvest alfalfa in the bud stage and fields never reach 10% bloom [P21]. A multiyear project was initiated to compare cored-hay samples and the fractionated stem samples described above. The results indicated that the P concentrations are higher in cored-baled samples compared to midstem samples, but that the decrease over time is similar [P20]. Reference values are currently being developed.
Close
Starter Phosphorus
Small amounts of P and N are commonly applied at planting. An adequate P supply promotes establishment of a strong root system, while N can increase uptake of P from the band [P11]. The application rate should be based on soil P and nitrate test values. Sheard [P29] recommended applying 60 lbs P2O5/acre when soil P availability is low and 30 lbs P2O5/acre when soil tests are adequate. In the same study, application rates of 90 lbs P2O5/acre reduced seedling growth. An application rate of 60 lbs P2O5/acre in the form of monoammonium phosphate results in an application of 13 lbs N/acre.
Starter fertilizer is best placed in a band two inches below the seed to ensure easy access by the growing roots [P11, P30]. Monoammonium phosphate (11-52-0) is a common starter fertilizer [P6]
Close
Foliar Phosphorus
Little research has been done investigating the effects of foliar P applications to alfalfa. Many phosphorus compounds have low water solubility. Therefore, the amount of P that could be applied with foliar sprays is likely too small compared to the plant’s requirements to have a big effect [P4]. When soil P availability is adequate, foliar P applications likely have little or no effect on yield.
A concentration exceeding 0.3% phosphoric acid in the foliar spray has been found to damage leaves and reduce yield while a 1% solution of NaH2PO4 had no negative effect [P13].
Close
Phosphorus Fertilization
The preplant P application rate should be based on soil test results, while the P status of established alfalfa stands is best assessed with a plant tissue test [P18].
Approximately 12 lbs P2O5/acre (5.2 lbs P/acre) are removed with each ton of alfalfa hay [P18]. Therefore, with a yield of 10 tons/acre, approximately 120 lbs P2O5/acre are removed each year.
When the soil or tissue P values suggest adequate P availability, applying the amount of P removed at harvest ensures that the soil P status is maintained in the long term. However, in soils with adequate P availability, the application of P may not result in a yield response. For high soil or leaf P values, the application rate can be reduced, while for low values it should be increased (see Soil P Test). When plant tissue or soil tests indicate P deficiency, 15 to 22.5 lbs P2O5/acre per ton of alfalfa harvested may be required [P18]. For more information, contact your local farm advisor.
To maintain the P status of alkaline soils, more P needs to be applied than is removed by crop uptake because P can be immobilized in the form of calcium phosphate. In a study carried out in Colorado on soils with a pH of 7.7 to 8.0, up to 2.2 times the removal rate needed to be applied to maintain soil P status. However, the increased rates had no effect on alfalfa yield [P5].
Preplant P is best incorporated into the top 2 to 4 inches of the profile [P18].
Several studies found that broadcasting P is as effective as banding it in [P7,P21, P31]. Roots near the surface are very active. However, adequate soil moisture is essential in order for the plant to recover surface-applied nutrients [P19]. When P is drilled in to a depth exceeding 1 inch in established stands, it has been found to decrease yield due to mechanical damage of roots [P12].
Banding fertilizer P may improve P recovery in very deficient soils or when the soil surface is dry, because root growth and uptake of surface-applied P is limited [P14]. When P is band applied, band spacing of 6 to 12 inches has been found to be more effective than band spacing of 24 inches [P9].
Phosphorus can also be applied with the irrigation water. However, when liquid fertilizer is applied through sprinkler systems, precipitation may occur in the system. The application uniformity of fertilizer applied with flood or border systems will depend on the water distribution [P7]. To prevent surface water pollution, no tailwater should leave the farm [P18].
Common fertilizers used in alfalfa are triple superphosphate (0-45-0), monoammonium phosphate (11-52-0) and liquid ammonium polyphosphate solution (10-34-0). Studies carried out in Southern California, Arizona and New Mexico did not find differences in yield and tissue P concentration between alfalfa fertilized with these materials [P3, P9, P21, P22, P23]. The selection of a specific P fertilizer can therefore be based on local availability, application preferences, and the cost per unit of nutrient [P19].
In calcareous soils in Utah with a pH ranging from 7.8 to 8.3, phosphoric acid did not provide a yield advantage relative to monoammonium phosphate and triple superphosphate [P25].
In fall planted alfalfa, preplant P applications have been found to produce a higher yield during the first year after planting than P applications the following spring [P27]. In established stands P can be applied anytime during the year, but applications made during the winter are preferred as it may take 60-90 days until a response of the alfalfa is observed [P18].
Meyer and coauthors [P18] recommended limiting single application rates to 100-150 lbs P2O5/acre. If higher application rates are required, one half of the fertilizer may be applied in late fall and winter, while the other half can be applied after the second or third cutting.
James and coworkers [P8] showed that soil P fertility for alfalfa can be maintained by either small annual applications or larger single applications for a multiyear crop rotation.
|
| Preplant | Sowing Growth | Seedling | Early Bud | Bloom | Established Stand |
|
Potassium (K2O)
|
Soil Test
|
|
Tissue Analysis
|
| |
Starter K
|
|
Foliar K
|
|
K Fertilization
|
|
Potassium (K2O)
Soil Test
Tissue Analysis
Starter K
Foliar K
K Fertilization
|
Close
Alfalfa Potassium Nutrition
Deficiency Symptoms
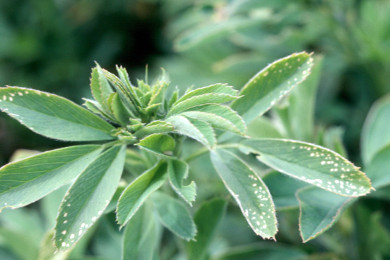
Potassium deficiency is characterized by circular, pinhead-sized spots along the margins, particularly near the tips of the leaflets [K20]. Spots are more common on upper leaves, while the tips and margins of more mature leaves turn yellow and the tissue dies [K12].
Potassium deficiency is often observed on the east side of the Sacramento and northern San Joaquin Valley [K9]. In these areas, soils derived from granitic parent material tend to fix K (see K Fixation in the San Joaquin Valley). Contact your local farm advisor for more information.
Potassium deficient alfalfa with characteristic circular spots along the margins and near the tips of the leaflets (photo provided by the International Plant Nutrition Institute).
Excessive Potassium
Very high soil K availability may result in excess K uptake by alfalfa plants. This is of little concern for alfalfa production. However, dairy cows fed with a diet high in K during the dry period before calving may develop milk fever because the high K concentrations may reduce calcium absorption and mobilization [K1].
Close
Soil Analysis
Soil tests are most useful for assessing nutrient availability prior to planting [K12]. If soil tests are taken in established stands, sampling may be repeated every 2 to 3 years [K5].
The tap root of alfalfa may grow to a depth of 9 feet or deeper [K21]. However, the root density is highest in the top 6-8 inches of the profile and more than half the total root mass is located in this layer [K8, K18].
Soil K availability is generally determined on samples taken from the top 6-12 inches of the profile [K5, K12].
The sample must be representative of the field it is taken from. Distinctly different areas should be sampled separately. A total of 15-20 cores from each field or unit should be taken and mixed thoroughly [K12]. Organic debris and plant material should be removed [K5]. A composite sample of about a pint in size from each field is placed in a double-thick paper bag and dried immediately at room temperature before being mailed to the laboratory [K9]. See Soil Test Sampling for more detailed sampling instructions.
Soil variability within a field can be addressed by establishing benchmark sites or by grid sampling.
For benchmark sites, a field is divided into three areas where, based on previous crops, alfalfa growth is good, medium and poor. Within each area, permanent benchmark locations of approximately 50 x 50 feet in size are established. Permanent benchmark locations that are sampled each time allow monitoring field variability and historic trends in nutrient availability [K5, K9, K11].
Variability within a field can also be assessed by grid sampling. A study carried out in five alfalfa fields located in Los Angeles and Siskiyou Counties showed that fertilizer costs can be reduced by applying variable rates based on sampling densities of one sample per 3 to 6 acres [K2].
Soil exchangeable K is generally determined on ammonium acetate extracts. An economic yield response to fertilizer application is likely when the soil is deficient, somewhat likely for values in the critical range and unlikely for values above the adequate level (see Table) [K9].
Interpretation of soil test results for alfalfa production [K12].
Response
Category |
Phosphorus
bicarbonate
extract (ppm) |
Potassium
ammonium
acetate (ppm) |
| Deficient |
<5 |
<40 |
| Critical |
5-10 |
5-80 |
| Adequate |
10-20 |
80-125 |
| High |
>20 |
>125 |
Close
Tissue Analysis
Plant tissue tests are useful in monitoring the P and K status of alfalfa and evaluating the effectiveness of current fertilization practices [K11]. Plant tissue should be sampled every year [K5].
Traditionally, tissue P and K have been determined on the stems of the middle third of plants. Recent research has shown that bale core samples may be used to determine P and K status of alfalfa. Both methods are described below.
Sampling instructions and sample handling [K11, K17]:
- Samples can be collected at any cutting. The first cutting is preferred for sulfur analysis. However, in non-dormant areas, the first cutting should be avoided for P and K analysis because of uneven spring growth [K19].
- Sample when the alfalfa is at the 10% bloom stage.
- Collect 40 to 60 stems from at least 30 plants.
- Cut stems into three sections of equal length (see Figure).
- Discard the bottom third.
- Place the top third in one paper bag and the middle third in another.
- Dry the samples.
- Separate leaves from stems in middle third by rubbing between hands.
- Put leaves in one bag and stems in another bag.
- Analyze stems from the middle third for phosphorus (PO4-P) and potassium (K). Analyze top third sample for boron (B), molybdenum (Mo), and copper (Cu). Use the leaves from the middle third for sulfur (SO4-S) analysis.
Traditional sample handling procedure for alfalfa tissue nutrient analysis.
Interpretation of test results for alfalfa midstem samples taken at 10% bloom stage [K10].
Response
Category |
Phosphorus
(ppm PO4-P) |
Potassium
(% total K) |
| Deficient |
<500 |
<0.65 |
| Critical |
50-800 |
0.65-0.80 |
| Adequate |
800-1500 |
0.80-1.50 |
| High |
>1500 |
>1.50 |
If the sample was taken at bud stage, the K values in the table need to be multiplied by 1.1 [K12].
An economic yield response to fertilizer application is very likely for values below the deficient level, somewhat likely for values in the critical level, and unlikely for values over the adequate level [K11].
Instructions for representative bale core sampling [K16]:
- Take a separate composite sample from each lot of hay. Lots must be from the same cutting, variety, field, stage of maturity and harvested within 48 hours. A lot must not exceed 150-200 tons.
- Use a good, sharp coring device with an inner diameter of 3/8 to 5/8 inch. An open auger or corkscrew type device should not be used.
- Take samples from random bales at various heights.
- Take one core from a minimum of 20 bales per lot. Take 20-40 cores in larger or variable lots.
- Probe the ends of bales near the center, and at least 12-18 inches into the bale. Probe should be at right angles to the bale end.
- Combine cored samples into a single sample and store it in a sealed polyethylene freezer bag. Do not expose to heat or direct sun.
- The sample should weigh about 0.5 lb.
- Send to the lab as soon as possible.
Interpretation of whole plant samples collected from baled hay taken at 10% bloom stage [K12].
Response
Category |
Phosphorus
(%) |
Potassium
(%) |
| Deficient |
<0.20 |
<0.8 |
| Critical |
0.21-0.22 |
0.81-1.09 |
| Adequate |
0.23-.030 |
1.10-1.40 |
| High |
>0.30 |
1.40-3.00 |
If sample was taken at bud stage, multiply K values by 1.1 [K12]. Current tissue level guidelines are based on alfalfa nutrient concentrations at 10% bloom growth stage. However, to produce highly digestible alfalfa for the dairy industry, growers harvest alfalfa in the bud stage and fields never reach 10% bloom [K14]. A multiyear project was initiated to compare cored-hay samples and the fractionated stem samples described above. The results indicated that the K concentrations are lower in cored-baled samples compared to midstem samples [K13]. Reference values are currently being developed.
Close
Starter Potassium
Starter fertilizers generally do not contain K.
Close
Foliar Potassium
Little research has been done investigating the effects
of foliar K applications to alfalfa. Potassium is required
in much larger amounts than what can be applied with
foliar fertilizers [K4].
With adequate soil K availability, foliar K applications
are likely to have limited effect on yield.
Close
Potassium Fertilization
The preplant K application rate should be based on soil test results, while the K status of established alfalfa stands is best assessed with a plant tissue test [K12].
Approximately 48 lbs K2O/acre (40 lbs K/acre) are removed with each ton of alfalfa hay [K12]. Therefore, with a yield of 10 tons/acre, approximately 480 lbs K2O /acre are removed each year. When the soil or tissue K values suggest adequate K availability, applying the amount of K removed at harvest ensures that the soil K status is maintained in the long term. However, in soils with adequate K availability, fertilization may not result in a yield response. For more information, contact your local farm advisor.
For high soil or leaf K values, the application rate can be reduced, while for low values it should be increased (see Soil K Test). When plant tissue or soil tests indicate K deficiency, up to 50 lbs K2O /acre per ton of alfalfa harvested may be required [K12].
Preplant K is best incorporated into the top 2 to 4 inches of the profile. In established stands, K can be applied to the soil surface [K12]. In a study carried out in Wisconsin, alfalfa yield did not differ between surface application and injection of KCl solution to a depth of 3 or 7 inches [K15].
The most economical K fertilizer is muriate of potash (KCl). If sulfur is also deficient, potassium sulfate (K2SO4) may be used [K12].
Potassium can be applied anytime during the year, but applications made during the winter are preferred [K12].
When K requirements are high, applications should be split [K6, K12]. If application rates higher than 200-300 lbs K2O /acre are required, one half of the fertilizer may be applied in late fall and winter, while the other half can be applied after the second or third cutting [K12]. However, Koenig and Barnhill [K7] reported higher yields with split K applications when the total application rate exceeded 400 lbs K2O /acre. In contrast, when K is applied according to soil test recommendations, splitting applications may not be beneficial [K3].
|