| |
|
|
|
|
|
|
Young Trees |
Dormancy |
Spring Flush; Bloom |
Fruit Development |
Harvest |
|
Nitrogen (N)
|
Soil Test
|
Leaf Analysis
|
|
|
N
|
|
|
|
|
Nitrogen (N)
Soil Test
Leaf Analysis
N
Soil Applied N
Foliar N
|
Close
Citrus Nitrogen Nutrition
Deficiency Symptoms
Growth of N deficient trees is reduced. Nitrogen deficiency symptoms on leaves include smaller leaves and pale green color. Lemon leaves may develop irregular yellow areas before becoming entirely yellow [N10, N27]. In general, older leaves show symptoms first because N is mobile in the plant. However, N deficiency of new leaves is frequently observed in early spring when N supply is insufficient due to cold or wet soils [N27].
Fruit production is greatly reduced under N deficiency, but quality is not seriously impaired. The fruit rind is smooth, may be somewhat pale in color, and fruit size may be decreased [N10].
Nitrogen deficiency symptoms may resemble P or sulfur deficiency, salinity or high water table. Leaf analyses help diagnose N deficiency [N10].
Excess Nitrogen
Nitrogen promotes vegetative growth, delays fruit maturity and may stimulate late-fall growth flushes which are vulnerable to winter frosts. Valencia oranges may regreen. Excess N may also result in fruits with thick peel and low sugar content [N10, N11].
Close
Soil Nitrate Test
Soil nitrate analyses are less common in orchards than in annual crops. However, soil nitrate analyses can provide information for the fine-tuning of the fertilization program.
Interpretation of the results is most informative when samples are taken from the same blocks used for leaf analysis. Blocks should be uniform with respect to soil properties, tree appearance, age, variety, and rootstock. Nutrient availability is generally determined in the top two feet of the profile, which is the zone where most of the fibrous roots are located [N32]. Samples need to be kept cool and analyzed as quickly as possible to minimize N mineralization before analysis. For more information on sampling procedure see Soil Sampling in Orchards.
Soil nitrate-N present in spring contributes to the tree’s N nutrition. One ppm of NO3-N per foot of soil corresponds roughly to 4 lbs N/acre. For example, a NO3-N concentration of 5 ppm in the top foot of the profile corresponds to 20 lbs N/acre. The N application rate should be adjusted for high residual nitrate concentrations.
High soil nitrate concentrations in late fall may be the result of excess N fertilizer applications during the growing season. Nitrate in the soil profile in fall is prone to leaching during the winter. High nitrate N concentrations below the root zone indicate that in addition to N, irrigation rates were also in excess of plant demand.
Close
Leaf Analysis N
Leaf samples are generally taken in September or October. The following leaf sampling protocol has been recommended [N14, N27]:
- Divide the orchard into uniform blocks of 5-10 acres (uniform with respect to soil properties, tree appearance, age, variety, and rootstock) and sample each block separately.
- Sample healthy terminal leaves from the spring flush.
- Sample leaves from non-fruiting and non-flushing shoots, 3-5 feet above the ground.
- Take one leaf from each quadrant of a tree.
- Sample each block in a diagonal or U-shaped pattern.
- Do not sample from border trees and from trees that differ in some respect from the rest of the orchard.
- Take at least 50 leaves from each block.
- Place samples in a clean paper or porous cloth bag. If stored in an ice chest, a clean plastic bag can also be used.
- Have samples analyzed without delay.
- Take samples for N analysis each year. If leaf P, K and micronutrient concentrations are sufficient, further analysis can be done every 4-5 years.
Leaf analysis guide for diagnosing nutrient status of mature Valencia and navel orange trees [N15, N27].
| Interpretation |
Nutrient (values in % dry weight) |
| |
Nitrogen |
Phosphorus |
Potassium |
| Deficient |
< 2.2 |
< 0.09 |
< 0.40 |
| Low |
2.2 - 2.3 |
0.09 - 0.11 |
0.40 - 0.69 |
| Optimum |
2.4 - 2.6 |
0.12 - 0.16 |
0.70 - 1.09 |
| High |
2.7 - 2.8 |
0.17 - 0.29 |
1.10 - 2.00 |
| Excess |
> 2.8 |
> 0.30 |
> 2.30 |
These values may be slightly different for mandarin but should be similar [N16]. Lemon optimum N is 2.5%, but some vigorous cultivars may not be able to achieve higher than 2.2% [N15]. While there is not much research on grapefruit, studies on desert California grapefruit give an optimum of 2.0%-2.2% [N15] and of Florida give an optimum of 2.2%-2.3% [N18].
It may take several years until different management practices are reflected by leaf N concentrations. It is therefore especially important to take annual leaf samples after making adjustments to the fertilizer program [N7].
Close
N Fertilization of Young Trees
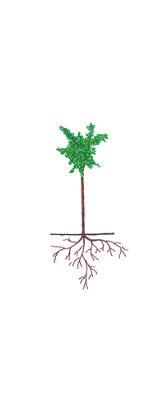
As young trees do not have well developed root systems yet, N should be split into 4 or 6 applications from late February through August [N16, N22, N33, N38]. Alternatively, slow release fertilizer can be used [N16]. Fertilizer applications in fall may reduce cold-hardiness [N38]. Consult your local farm advisor for the recommended cutoff date in your area. Recommended N application rates to young citrus trees for California [N16], Florida [N38] and Arizona [N43].
| Tree age (years) |
Foothills, CA |
Florida |
Arizona |
| |
Application rate (lbs N/tree/year) |
| 1 |
0.13 - 0.25 |
0.15 - 0.30 |
0 |
| 2 |
0.25 - 0.50 |
0.30 - 0.60 |
0.15 |
| 3 |
0.50 - 0.75 |
0.45 - 0.90 |
0.23 |
Nitrogen fertilizer requirements of young citrus trees depend on the N supplying capacity of the soil. The lower limit of the ranges in the table is adequate for soils with a soil organic matter content of 2% or more and soils previously used for pasture or vegetable production [N38]. Leaf analyses indicate whether the application rates are adequate.
Fake [N16] recommended treating trees from the fourth year on as mature trees, thus applying 1 to 1.5 lbs N/tree per year. A study carried out in Arizona on a fine sandy loam found that the optimal annual N rate for years four to six was between 0.25 and 0.33 lbs/tree [N22]. For more information about N fertilzation of young citrus trees, contact your local farm advisor.
Close
Soil Applied Nitrogen
Applying some of the N with foliar sprays and the rest by fertigation has been found to be a very effective N fertilizer program, which ensures high yield and fruit quality, while reducing the risk of nitrate leaching [N5, N7].
In a study carried out from 1997 to 2002 in Tulare County in a mature navel orange orchard, Arpaia and Lund [N7] found that maximum production was achieved with N application rates between 1.0 and 1.5 lbs/tree. With a tree spacing of 22x20 feet, this application rate corresponds to 100-150 lbs N/acre [N7]. These results are in line with earlier studies in Southern California and the San Joaquin Valley which showed that navel and Valencia orange yields were maximized with annual N rates of 1.0-1.4 lbs N/tree. The yields ranged from 15,300 to 46,100 lbs/acre [N13]. Both studies found that the fertilizer N requirements did not differ between foliar and soil applied treatments.
The amount of N removed with 1000 lbs of fruit ranges from 1.15-1.85 lbs [N13, N23, N37]. The N concentration was found to increase with increasing N rates, but not to differ much between oranges, lemons and grapefruits [N13]. For more information see Citrus Nitrogen Uptake and Partitioning. Therefore, with the average California yield of 22,500 lbs/acre, which corresponds to 300 boxes of 75 lbs, between 26 and 42 lbs N are removed from the field (See Table). Nutrients removed with harvested fruits[N13, N23, N37].
| Yield (lbs/acre) |
Nutrients removed (lbs/acre) |
| |
Nitrogen |
P2O5 |
K2O |
| 20,000 |
23 - 37 |
7.8 - 8.8 |
36 - 47 |
| 30,000 |
35 - 56 |
11.7 - 13.2 |
53 - 71 |
| 40,000 |
46 - 74 |
15.6 - 17.6 |
71 - 94 |
| 50,000 |
58 - 93 |
19.5 - 22.0 |
89 - 118 |
Annual biomass N accumulation in leaves and permanent organs has been found to be 0.1-0.15 lbs/tree [N17, N31]. Based on the tree density reported in these trials, this annual accumulation corresponds to 20-25 lbs N/acre.
Adding N accumulation in leaves and wood to the N in fruits and assuming an N use efficiency of 70%, this would result in N application rates of 70 to 95 lbs/acre. This corresponds to 0.70-0.95 lbs/tree for an orchard with a tree spacing of 22x20 feet. Fertilizer use efficiency is higher in drip and microsprinkler irrigated orchards than with flood irrigation [28].
Fertigation
Frequent N applications through the drip system (fertigation) is an efficient way for applying N [N5, N40]. The fertilizer should be injected into the irrigation system in the middle third of the irrigation set. For example, in a 18-hour irrigation set, fertilizer is injected from hour 6 through hour 12. This prevents urea and nitrate from moving below the root zone but still ensures that the N is distributed well in the wetting zone and does not remain in the irrigation system [N35].
Granular fertilizer
Urea and to a lesser degree ammonium may be lost through ammonia volatilization, especially when applied to the surface of dry and alkaline soils without being incorporated [N9]. These materials need to be incorporated as soon as possible. Fertilizers are best applied in the herbicide strip along the tree rows and not broadcast over the entire area. Fertilizer applied between the rows is less efficiently used due to competition with weeds or cover crops and lower tree root density compared to the tree row [N35].
A number of mineral N fertilizers are available to growers. Mineral fertilizers contain N in the form of urea, ammonium, nitrate or a mix of them. These N forms behave differently in the environment. Nitrate is very mobile in the soil and can easily be leached below the root zone with irrigation water or rain. Urea is also relatively mobile and is generally quickly converted to ammonium. Ammonium is less mobile, but is generally converted quickly to nitrate by soil microorganisms in warm and moist soils, unless they are water saturated. This process, nitrification, can lower soil pH. The acidifying effect is especially strong when ammonium fertilizers are applied by drip systems as they are concentrated in a small soil volume [N44].
Citrus trees are sensitive to biuret, which is a byproduct of urea production. Biuret toxicity is characterized by chlorosis of the leaf tip (yellow tip). The leaves do not regreen [N19, N20]. Urea containing up to 2.5% biuret has been found to be safe for soil applications [N20]. This concentration is higher than the biuret concentration found in urea fertilizers currently produced in North America, which have a biuret concentration of less than 1.0-1.3% [N30]. Biuret does not accumulate in the soil and is broken down in about 6 weeks [N20]. Therefore, for soil applications, biuret is generally not a concern.
Studies carried out in Florida on sandy soils showed that controlled release fertilizers may reduce the risk of nitrate leaching losses. However, when leaching is minimized with careful timing of fertilizer applications and irrigation, the benefits of controlled release fertilizers are likely small [N4, N39]. Furthermore, in one study controlled release fertilizer applications in early February resulted in reduced yields. The authors concluded that N release was too slow to meet the high N requirement during the initial 3–4 months after its application [N6].
Fertigation
Many soluble N fertilizers, such as UAN, urea and ammonium sulfate work well with fertigation. Anhydrous and aqua ammonia can also be used for fertigation. However, they increase water pH, which may result in precipitates if the water contains calcium or magnesium. The high water pH also increases the risk of ammonia volatilization losses [N42].
Nitrogen uptake is generally lowest during dormancy, increased during flowering and highest during fruit set [N21, N24]. For more information see Citrus Nitrogen Uptake and Partitioning.
For optimal growth and production of citrus, about two-thirds of the annual N requirement should be supplied between early spring flush and fruit set [N6]. N fertilizer applications should be completed by early fall to avoid stimulation of late growth which may be susceptible to cold damage or impacts on fruit quality [N16]. Consult your local farm advisor for for the appropriate timing in your area.
During spring flush and flowering, N reserves from older tissues are mobilized and used for new leaves and flowers [N12, N29]. The ability to mobilize N from permanent tissue and the canopy may be the reason why citrus trees do often not respond to split N applications [N34]. However, a study carried out in Tulare County found that even though yield did not differ significantly between treatments, nitrate leaching below the root zone was greatly reduced with two annual applications in late winter and late May, compared to a single application in late May [N7]. Applying N with every irrigation from late winter through fall also resulted in higher leaching rates than split treatment with two applications.
Close
Foliar Nitrogen
Foliar fertilizers can correct nutrient deficiencies more rapidly than soil applied fertilizers and can be properly timed to key developmental stages. However, the amount of foliar fertilizers that can be supplied with one application is limited to prevent leaf damage. Therefore, foliar fertilizers are best used to supplement soil applied fertilizers [N27].
Applying N as foliar sprays may also reduce N leaching. Arpaia and Lund [N7] reported that foliar applications resulted in lower nitrate-N concentrations in the soil profile below the root zone than N applications through the irrigation system. The same study found that trees receiving N only with foliar sprays tended to have lower yields compared to trees receiving the same amount of N applied to the soil or as combined soil and foliar applications; however, the specific proportion of soil- to foliar-applied fertilizer did not have a consistent effect on yields [N7].
The yield effect of foliar urea applications was found to be most pronounced in orchards with low leaf N concentrations, while it was small or absent when N leaf concentrations exceeded 2.6% [N41].
The application of low-biuret urea can quickly correct N deficiencies; however a minimum of three foliar applications would be required to meet the annual N needs of citrus trees. High concentrations can lead to ammonia toxicity [N27].
Low-biuret urea is generally applied at the rate of 50 lbs in 200 gallons of water per acre (23 lbs N/acre).
Low-biuret urea is the most common source of foliar N. Potassium nitrate (KNO3) is also used.
Citrus trees are sensitive to biuret, which is a byproduct of urea production [N19]. Biuret toxicity is characterized by chlorosis of the leaf tip. The leaves do not regreen [N19, N20]. Low-biuret urea with a biuret concentration of less than 0.25% is considered safe to use [N2, N20]. Urea with a biuret concentration of 0.5% was found to cause slight damage when two consecutive sprays of 18 lbs N/acre were applied [N2]. Repeated sprays may have a cumulative effect because biuret is slowly metabolized in plants [N30].
Winter prebloom foliar applications of low-biuret urea have been shown to increase yield [N1, N3], while summer applications can increase fruit size [N25].
The optimal time for pre-bloom applications in southern California is from December 15 to February 15 [N27]. Winter foliar application of 0.35 lbs N/tree in the form of low-biuret urea significantly increased yield of mature navel orange trees in Riverside. The foliar application was in addition to 1.1 lbs N/tree of soil-applied urea [N3]. In a Florida study, prebloom foliar applications of urea (28-31 kg/ha) to mature Valencia trees increased yield and soluble solids in juice compared to the control [N1]. In a study carried out with ‘Nules’ Clementine mandarins in a Fresno orchard, a January prebloom application of low-biuret urea (23 lbs N/acre) tended to increase yield and significantly increased yield of large fruits. In contrast, three applications of 28 kg KNO3/ha in February, late May and July had no effect on yield and fruit size [N26, N45].
Summer foliar urea should be applied before the end of the cell division stage, characterized by maximum peel thickness, which is between early June and late July in California. Low-biuret urea is applied at the rate of 50 lbs in 200 gallons of water per acre (0.35 lbs/tree; 23 lbs N/acre) [N25]. In Valencia oranges, urea applications close to harvest can result in regreening [N27].
Foliar fertilizers are best applied early in the morning when the plant’s stomata are open [N8, N27].
|
| Young Trees | Dormancy | Spring Flush; Bloom | Fruit Development | Harvest |
|
Phosphorus (P2O5)
|
Soil Test
|
|
Leaf Analysis
|
|
|
P
|
Soil Applied P
|
Foliar P
|
|
|
Phosphorus (P2O5)
Soil Test
Leaf Analysis
P
Soil Applied P
Foliar P
|
Close
Citrus Phosphorus Nutrition
Deficiency Symptoms
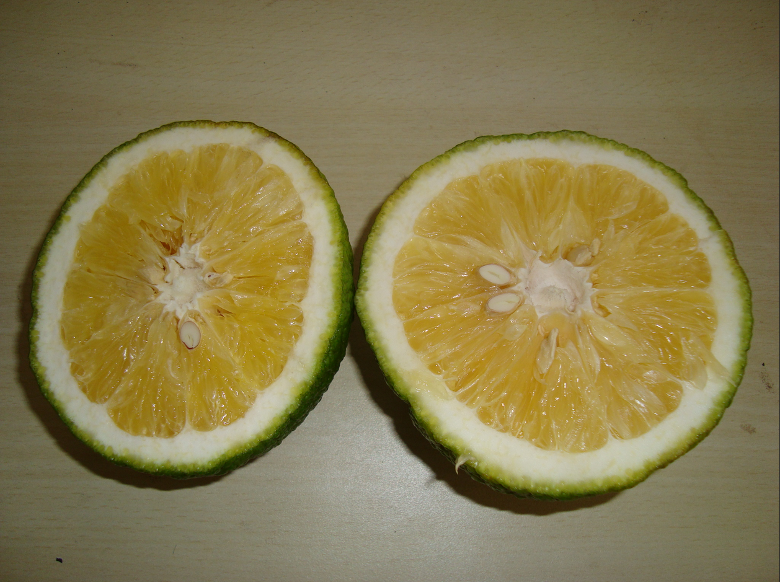
The earliest effects of low P availability are on fruit quality [P4]. Low P availability results in sponginess, thick rinds, and low juice content [P5]. Since the effects of low P and excess N on rinds and juice content are similar, the effects of P deficiency on fruit are stronger when too much N fertilizer has been used [P9]
Phosphorus deficient citrus with thick rind (Photo provided by the International Plant Nutrition Institute.
Leaves of P deficient orange and lemon trees are reduced in size, have a dull brownish green color and lack luster. Leaves may develop necrotic areas at the tip and later in various locations on the leaf blade. Older leaves show symptoms first [P12, P15].
Excess Phosphorus
Excess P may cause copper (Cu) and zinc (Zn) deficiency [P2]. High P availability also tends to decrease fruit size and juice acidity [P5].
Close
Soil Analysis
Soil samples taken before an orchard is planted provide valuable information about soil conditions, salinity and nutrient availability. Soil analyses for nutrient availability are less common in existing orchards, as decisions are generally based on leaf analyses [P10]. However, periodic check-ups help evaluating the fertilization program [P3].
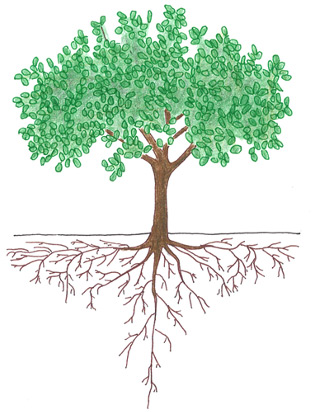
While soil samples for salinity analysis may be taken to a depth of 4 feet or more [P21], nutrient availability is generally determined in the top two feet of the profile, which is the zone where most of the fibrous roots are located. However, studies in Florida involving a range of rootstocks showed that citrus roots may reach to a depth of 7 to 12 feet. Poor drainage and a compacted or poorly aerated soil layer severely limit vertical root development [P16, P17].
For sampling purposes, the orchard should be divided into uniform blocks with respect to soil properties, tree appearance, age, variety, and rootstock. Interpretation of the results is most informative, when samples are taken from the same blocks used for leaf analysis.
Samples should always be taken around the same time of the year to better detect long-term trends. The same samples can be used for nutrient and salinity analyses. Sampling for P and in fall post-harvest gives ample time to detect and correct deficiencies and is also most informative for salinity evaluation. However, P and K samples can be taken at any time of year [P21]. For more information on sampling procedure see Soil Sampling in Orchards.
Phosphorus availability strongly depends on soil pH. In acidic soils, P is immobilized by iron and aluminum minerals, while the predominant mechanism of P immobilization in alkaline soils is the formation of insoluble calcium phosphate compounds. For this reason, the recommended soil test depends on soil pH. For acidic to neutral soil (pH < 7.0), the Bray P1 test is generally used. For neutral and alkaline soils (pH > 6.5), the Olsen method is more appropriate [P11]. Using a test that is inappropriate for the soil analyzed may lead to inaccurate interpretation.
No University of California optimal soil test range specific to citrus is available. For orchards in general, Fulton [P11] recommended an optimum Olsen P range of 10-20 ppm (see Table). This is in line with early work by Chapman, who recommended Olsen P values of at least 11 ppm [P3].
For the Bray P1 method, a value of 40 ppm as the threshold between medium and high P availability is also recommended in Florida [P19]. Interpretation of P and K soil test results in orchards [P11].
| Fertility level |
Phosphorus (ppm PO4-P) |
Potassium (ppm K) |
| |
Bray P1 Method |
Olsen Method |
|
| Very low |
|
|
< 75 |
| Low |
< 20 |
< 10 |
75-150 |
| Medium |
20-40 |
10-20 |
150-250 |
| High |
40-100 |
20-40 |
250-800 |
| Excessive |
> 100 |
> 40 |
> 800 |
When leaf or soil analyses suggest that P fertilization may be beneficial, the application rate can be based on the amount of P removed with harvested fruits (See Soil Applied P).
Close
Leaf Analysis
Leaf samples are generally taken in September or October. The following leaf sampling protocol has been recommended [P8, P15]:
- Divide the orchard into uniform blocks of 5-10 acres (uniform with respect to soil properties, tree appearance, age, variety, and rootstock) and sample each block separately.
- Sample healthy terminal leaves from the spring flush.
- Sample leaves from non-fruiting and non-flushing shoots, 3-5 feet above the ground.
- Take one leaf from each quadrant of a tree.
- Sample each block in a diagonal or U-shaped pattern.
- Do not sample from border trees and from trees that differ in some respect from the rest of the orchard.
- Take at least 50 leaves from each block.
- Place samples in a clean paper or porous cloth bag. If stored in an ice chest, a clean plastic bag can also be used.
- Have samples analyzed without delay.
- Take samples for N analysis each year. If leaf P, K and micronutrient concentrations are sufficient, further analysis can be done every 4-5 years.
Leaf analysis guide for diagnosing nutrient status of mature Valencia and navel orange trees [P9, P15].
| Interpretation |
Nutrient (values in % dry weight) |
| |
Nitrogen |
Phosphorus |
Potassium |
| Deficient |
< 2.2 |
< 0.09 |
< 0.40 |
| Low |
2.2 - 2.3 |
0.09 - 0.11 |
0.40 - 0.69 |
| Optimum |
2.4 - 2.6 |
0.12 - 0.16 |
0.70 - 1.09 |
| High |
2.7 - 2.8 |
0.17 - 0.29 |
1.10 - 2.00 |
| Excess |
> 2.8 |
> 0.30 |
> 2.30 |
The values for P and K in the table are also valid for grapefruit, lemon and probably other citrus species [P8].
Close
P Fertilization of Young Trees
Applications of P to young trees should be based on the initial soil test analysis. There are currently no University of California recommendations for P fertilization of citrus orchards. The recommendations used in Florida are summarized in the Table [P20]. Whether the fertilization program is adequate can be tested with leaf samples. Phosphorus application rates to young trees recommended for Florida citrus production [P20].
| Tree age (years) |
Soil test P |
| |
very low |
low |
medium |
high |
very high |
| |
Application rate (lbs P2O5/tree/year) |
| 1 |
0.15 - 0.30 |
0.11 - 0.23 |
0.08 - 0.15 |
0 |
0 |
| 2 |
0.30 - 0.60 |
0.23 - 0.45 |
0.15 - 0.30 |
0 |
0 |
| 3 |
0.45 - 0.90 |
0.34 - 0.68 |
0.23 - 0.45 |
0 |
0 |
Close
Soil Applied Phosphorus
There are currently no University of California recommendations for P fertilization of citrus orchards. Soil and leaf analyses can be used to monitor the P status of an orchard over the years to ensure that P availability is adequate (See Soil P Test and Tissue P Analysis).
In the long term, the amount of P removed at harvest needs to be replaced with fertilizer to maintain adequate P availability. Approximately 0.39 - 0.44 lbs P2O5 (0.17-0.19 lbs P) are removed from the orchard with 1000 lbs of harvested oranges [P13, P18]. Therefore, when 300 boxes of 75 lbs are harvested, which corresponds to the average California yield of 22,500 lbs/acre, less than 0.1 lb P2O5/tree or 10 lbs P2O5 are removed with the fruits (see Table). Nutrients removed with harvested fruits [P7, P13, P18].
| Yield (lbs/acre) |
Nutrients removed (lbs/acre) |
| |
Nitrogen |
P2O5 |
K2O |
| 20,000 |
23 - 37 |
7.8 - 8.8 |
36 - 47 |
| 30,000 |
35 - 56 |
11.7 - 13.2 |
53 - 71 |
| 40,000 |
46 - 74 |
15.6 - 17.6 |
71 - 94 |
| 50,000 |
58 - 93 |
19.5 - 22.0 |
89 - 118 |
For Florida, Obreza and coworkers [P20] recommend applying 0.9 lbs P2O5 per 1000 lbs of oranges harvested when the soil test value is in the medium range. The P application rate can be increased by 50 and 100% when P availability is low and very low, respectively. When leaf analyses or soil P test values suggest high P availability, application rates can be reduced or skipped (see Soil P Test).
Early research in California suggested that about 4.5-7 lbs P2O5 per mature tree is usually effective for 4-5 years on P deficient sites [P9]. Contact your local farm advisor for more information.
Phosphorus can be applied in a band around the dripline of the trees or banded in a 6-8 inches deep furrow [P6, P9]. Incorporation increases P availability, because P is immobilized by soil minerals and not leached into the root zone with irrigation or rainwater.
Care must be taken when P is fertigated. Phosphorus sources may precipitate as calcium or magnesium phosphates and clog emitters. The formation of precipitates may be minimized when the water pH is lowered to 4.0 - 4.5 with sulfuric or phosphoric acid. Phosphorus is quickly immobilized in the soil and does not move far into the profile or away from the emitters [P22].
Phosphorus is immobile in the soil and barely leached. For this reason, the time of application is not as crucial as it is for N. However, P can be strongly fixed by soil minerals. Where soils tend to fix P, it may be more effective to apply P closer to the time of demand. Contact your local farm advisor for more information.
Close
Foliar Phosphorus
Foliar fertilizers can correct nutrient deficiencies more rapidly than soil applied fertilizers and can be properly timed to key developmental stages. However, the amount of foliar fertilizers that can be supplied with one application is limited to prevent leaf damage. Therefore, foliar fertilizers are best used to supplement soil applied fertilizers [P15].
Potassium phosphite, ammonium phosphite and phosphorous acid are used as foliar fertilizers. Phosphite is the form of P most readily absorbed by the plant [P23].
Winter prebloom foliar applications of potassium phosphite (Nutri-Phite; 0-28-26) have been shown to increase yield [P1], while summer applications can increase fruit size [P14].
In a Florida study, prebloom foliar applications of Nutri-Phyte (0.65 gal/acre) to mature Valencia trees increased yield and soluble solids in juice compared to the control [P1].
Nutri-Phite most effectively increased fruit size when applied twice, around mid-May and mid-July. 0.5 gallons were applied in 200 gallons of water per acre each time. This corresponds to 1.8 lbs P2O5/acre and 1.7 lbs K2O/acre per application [P14].
Foliar fertilizers are best applied early in the morning when the plant’s stomata are open [P15].
|
| Young Trees | Dormancy | Spring Flush; Bloom | Fruit Development | Harvest |
|
Potassium (K2O)
|
Soil Test
|
|
Leaf Analysis
|
|
|
K
|
|
|
|
|
Potassium (K2O)
Soil Test
Leaf Analysis
K
Soil Applied K
Foliar K
|
Close
Citrus Potassium Nutrition
Deficiency Symptoms
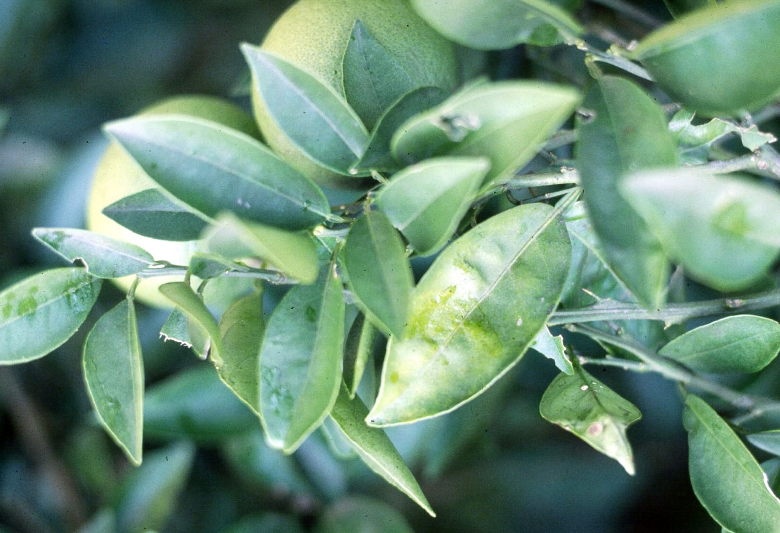
Growth of K deficient trees is reduced and lateral shoots are weak [K5]. Potassium deficient leaves are small and show yellow-bronze chlorotic patterns, especially along the leaf edges [K15]. Potassium is very mobile in the plant and can be removed from older leaves and transported to growing leaves. For this reason, older leaves show symptoms first [K15].
On orange and grapefruit trees the chlorosis develops primarily on leaves behind fruits, and may not be easily recognized even when the deficiency is severe. Therefore, visual symptoms should be confirmed with a leaf analysis [K9].
Leaves may also be curled toward the lower leaf surface, particularly on lemon trees. Leaf curling may also occur on healthy lemon trees, but the leaves do not become chlorotic. Potassium deficient orange and grapefruit trees usually do not exhibit this particular kind of leaf curl [K9, K15].
Potassium deficiency reduces fruit size [K6, K20].
Citrus leaves showing symptoms of K deficiency (Photo provided by the International Plant Nutrition Institute.
Excess Potassium
Excess K results in large fruits with coarse, thick rinds. Excess K may also affect fruit quality by lowering total solids and increasing acid concentrations [K5, K6].
Close
Soil Analysis
Soil samples taken before an orchard is planted provide valuable information about soil conditions, salinity and nutrient availability. Soil analyses for nutrient availability are less common in existing orchards, as decisions are generally based on leaf analyses [K11]. However, periodic check-ups help evaluating the fertilization program [K4].
While soil samples for salinity analysis may be taken to a depth of 4 feet or more [K21], nutrient availability is generally determined in the top two feet of the profile, which is the zone where most of the fibrous roots are located. However, studies in Florida involving a range of rootstocks showed that citrus roots may reach to a depth of 7 to 12 feet. Poor drainage and a compacted or poorly aerated soil layer severely limit vertical root development [K16, K17].
For sampling purposes, the orchard should be divided into uniform blocks with respect to soil properties, tree appearance, age, variety, and rootstock. Interpretation of the results is most informative, when samples are taken from the same blocks used for leaf analysis.
Samples should always be taken around the same time of the year to better detect long-term trends. The same samples can be used for nutrient and salinity analyses. While samples for P and K can be taken any time during the year, post-harvest samples are most informative for salinity evaluation [K21]. For more information on sampling procedure see Soil Sampling in Orchards.
The ammonium acetate extraction method is the most common method to determine soil K availability. No University of California optimal soil test range specific to citrus is available. For orchards in general, Fulton [K12] recommended an optimum extractable K range of 150-250 ppm (see Table). This is somewhat higher than the 100 ppm recommended by Chapman [K4]. Interpretation of P and K soil test results in orchards [K12].
| Fertility level |
Phosphorus (ppm PO4-P) |
Potassium (ppm K) |
| |
Bray P1 Method |
Olsen Method |
|
| Very low |
|
|
< 75 |
| Low |
< 20 |
< 10 |
75-150 |
| Medium |
20-40 |
10-20 |
150-250 |
| High |
40-100 |
20-40 |
250-800 |
| Excessive |
> 100 |
> 40 |
> 800 |
When soil or leaf analyses suggest that K fertilization may be beneficial, the application rate can be based on the amount of K removed with harvested fruits each year (See Soil Applied K).
Close
Leaf Analysis
Leaf samples are generally taken in September or October. The following leaf sampling protocol has been recommended [K9, K15]:
- Divide the orchard into uniform blocks of 5-10 acres (uniform with respect to soil properties, tree appearance, age, variety, and rootstock) and sample each block separately.
- Sample healthy terminal leaves from the spring flush.
- Sample leaves from non-fruiting and non-flushing shoots, 3-5 feet above the ground.
- Take one leaf from each quadrant of a tree.
- Sample each block in a diagonal or U-shaped pattern.
- Do not sample from border trees and from trees that differ in some respect from the rest of the orchard.
- Take at least 50 leaves from each block.
- Place samples in a clean paper or porous cloth bag. If stored in an ice chest, a clean plastic bag can also be used.
- Have samples analyzed without delay.
- Take samples for N analysis each year. If leaf P, K and micronutrient concentrations are sufficient, further analysis can be done every 4-5 years.
Leaf analysis guide for diagnosing nutrient status of mature Valencia and navel orange trees [K10, K15].
| Interpretation |
Nutrient (values in % dry weight) |
| |
Nitrogen |
Phosphorus |
Potassium |
| Deficient |
< 2.2 |
< 0.09 |
< 0.40 |
| Low |
2.2 - 2.3 |
0.09 - 0.11 |
0.40 - 0.69 |
| Optimum |
2.4 - 2.6 |
0.12 - 0.16 |
0.70 - 1.09 |
| High |
2.7 - 2.8 |
0.17 - 0.29 |
1.10 - 2.00 |
| Excess |
> 2.8 |
> 0.30 |
> 2.30 |
Early research indicated that it is difficult to increase the leaf K concentration to the adequate range once it drops below 0.7%, even with several years of K applications. Consequently, the K leaf concentration should be kept above 0.7% [K9].
Close
K Fertilization of Young Trees
Applications of K to young trees should be based on the initial soil analysis. There are currently no University of California recommendations for citrus K fertilization. If soil test values indicate low or very low K availability, Florida extension recommends K2O application rates of 0.15-0.30 lbs/tree during the first year, 0.3-0.6 lbs/tree during the second year, and 0.45-0.9 lbs to 3-year old trees [K19].
In areas where soils are known to fix K, such as the east side of the San Joaquin Valley, analyzing the soil for its K fixation capacity before the orchard is planted helps planning the K fertilization program. A discussion about K fixation in the San Joaquin Valley can be found here. For more information about soil K availability in your area, contact your local farm advisor.
Close
Soil Applied Potassium
There are currently no University of California recommendations for citrus K fertilization. Leaf and soil analyses should be used to monitor the K status of an orchard over and to plan K applications (See Soil K Test and Leaf K Analysis).
Between 1.78 and 2.36 lbs K2O (1.48 - 1.96 lbs K) are removed from the orchard with 1000 lbs of harvested oranges [K13, K18]. Therefore, with the average California yield of 22,500 lbs/acre, which corresponds to 300 boxes of 75 lbs, between 40 and 53 lbs K2O are removed from the orchard (see Table). Nutrients removed with harvested fruits [K8, K13, K18].
| Yield (lbs/acre) |
Nutrients removed (lbs/acre) |
| |
Nitrogen |
P2O5 |
K2O |
| 20,000 |
23 - 37 |
7.8 - 8.8 |
36 - 47 |
| 30,000 |
35 - 56 |
11.7 - 13.2 |
53 - 71 |
| 40,000 |
46 - 74 |
15.6 - 17.6 |
71 - 94 |
| 50,000 |
58 - 93 |
19.5 - 22.0 |
89 - 118 |
The response to K fertilization depends on soil type. Lighter textured soils are generally more responsive to K applications than heavier soils [K10]. 2.5-6 lbs K2O per mature tree applied for two consecutive years may be effective for several years [K9, K10]. With a density of 120 trees/acre, this corresponds to 300-720 lbs K2O/acre.
When soil applications are not effective, e.g. in soils that strongly fix K, foliar sprays are an alternative [K10].
Potassium can be applied in a band around the dripline of the trees or banded in a 6-8 inches deep furrow [K7, K10].
Potassium fertilizer can also be applied through the drip system [K22].
For fertigation, both potassium chloride (KCl; muriate of potash) and potassium sulfate can be used. The solubility of potassium sulfate is lower [K22]. However, when soil salinity is of concern, potassium chloride should not be used [K9].
On poorly drained soils, salinity problems have also been reported with applications of potassium sulfate exceeding 10 Ibs/tree [K9]. Potassium nitrate (KNO3), though expensive, is a good choice where irrigation water salinity problems are present. The solubility of KNO3 is intermediate between potassium sulfate and potassium chloride [K2]. The nitrogen applied with KNO3 needs to be considered for the annual N budget.
Potassium thiosulfate is acceptable but care must be taken in blending with other fertilizers, and blends must not be acidified below pH 6.0. Potassium phosphates should not be used in microirrigation systems [K2].
Fertilization with K can be effective at any time during the growing season [K23].
Close
Foliar Potassium
When soil applications are not effective, such as on K-fixing soils, foliar sprays are an alternative [K3]. Foliar fertilizers can correct nutrient deficiencies more rapidly than soil applied fertilizers and can be properly timed to key developmental stages. However, the amount of foliar fertilizers that can be supplied with one application is limited to prevent leaf damage. Therefore, foliar fertilizers are best used to supplement soil applied fertilizers [K15].
Potassium phosphite and potassium nitrate are common foliar fertilizers. Potassium thiosulfate, monopotassium phosphate and dipotassium phosphate are also used [K24]. Nitrate added as KNO3 should be taken into account as part of the total N requirement.
Foliar sprays are best applied in late spring or early summer shortly after expansion of the major growth flush. An application rate of 30 lbs of potassium nitrate per 100 gallons of spray is generally recommended. For a mild deficiency one annual spray suffices, for a moderate to severe deficiency, two annual sprays may be required [K9, K10]. In contrast to soil applied K, foliar sprays have little carry-over effect from one year to the next [K10].
Winter prebloom foliar applications of potassium phosphite (Nutri-Phite; 0-28-26) have been shown to increase yield [K1], while summer applications can increase fruit size [K14]. In a Florida study, prebloom foliar applications of Nutri-Phyte (0.65 gal/acre) to mature Valencia trees increased yield and soluble solids in juice compared to the control [K1].
Nutri-Phite most effectively in increased fruit size when applied twice, around mid-May and mid-July. 0.5 gallons were applied in 200 gallons of water per acre each time. This corresponds to 1.8 lbs P2O5/acre and 1.7 lbs K2O/acre per application [K14].
Foliar fertilizers are best applied early in the morning when the plant’s stomata are open [K15].
|


