Close
Lettuce Nitrogen Nutrition
Deficiency Symptoms
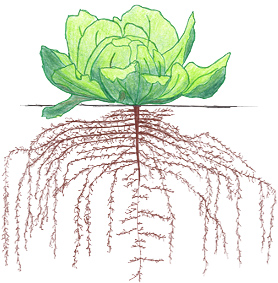
Growth of N deficient plants is slow. Leaves are pale green and older leaves turn yellow and die early. As N is mobile in plants, older leaves are the first to show N deficiency symptoms [N37, N39].
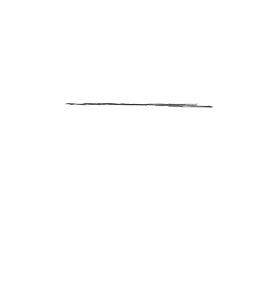
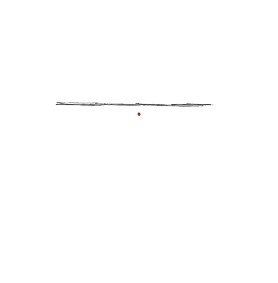
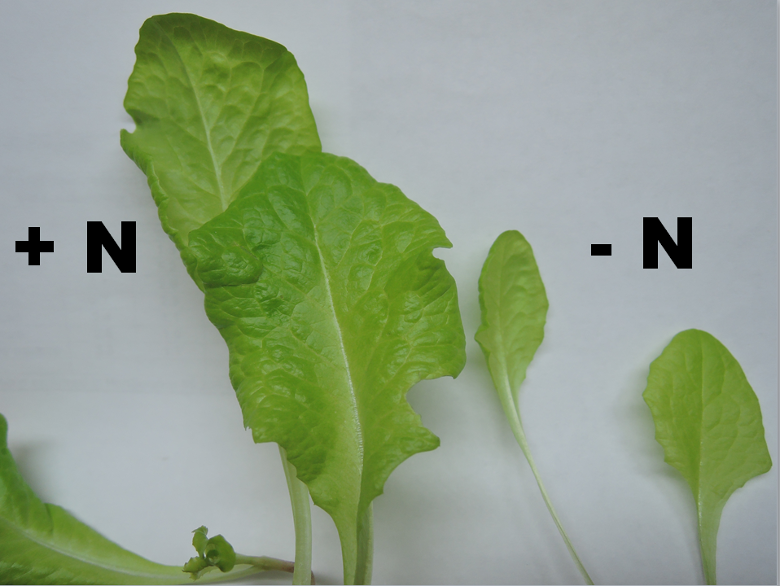
The leaves of the N deficient seedling on the right are pale green and much smaller (photo taken by Patricia Lazicki).
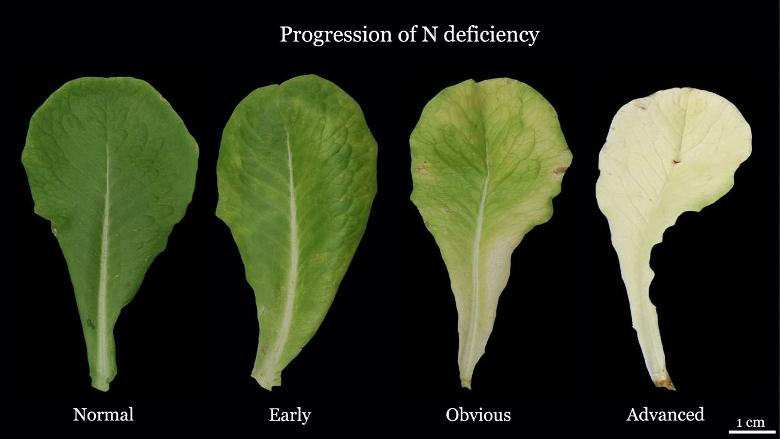
Progression of N deficiency symptoms on lettuce leaves (photo provided by the International Plant Nutrition Institute).
Excessive Nitrogen
Application of moderate rates of N and P enhance postharvest quality. However, high P and N application rates increase the sugar content, which in turn can increase the severity of bacterial diseases, reducing the shelf life of lettuce [N19]. High soil nitrate concentrations may also increase the occurrence of corky roots [N38].
Close
Soil Nitrate Test
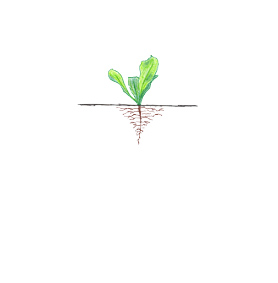
Samples are taken from the top foot of the soil profile, which is the major rooting zone for lettuce [N20, N21]. Zones of recently banded fertilizer applications should be avoided so that the N availability is not over-estimated [N11]. For more information on sampling procedure see Sampling for Soil Nitrate Determination).
Young lettuce plants require little N, as approximately 70% of the total N is taken up between heading and harvest [N21, N30, N33, N41]. Therefore, taking a soil sample after thinning, prior to the first in-season N application, and a second 2-3 weeks later provides sufficient information to schedule N applications throughout the season [N13].
Soil samples can be sent to a laboratory or extracted and analyzed on the farm. The soil nitrate quick test with colorimetric test strips is highly correlated with the standard laboratory technique and has been found to be a reliable estimate of current soil N status. Although the quick test is less accurate than a standard laboratory analysis, its accuracy is generally sufficient for routine on-farm use when done correctly. With the quick test, soil nitrate can be determined in a timely manner in order to make N fertilization decisions [N14, N15].
For the soil nitrate quick test, 30 mL of a of a calcium chloride (0.01 M) or an aluminum sulfate (0.025 M) solution are measured into a clean 2-oz bottle or a centrifuge tube with a mark at 40 mL. Field moist soil is added until the extractant reaches the mark. The tube is then capped and vigorously shaken for about 1 minute to disperse all the aggregates. The soil particles are allowed to settle until clear supernatant forms. The nitrate concentration in the supernatant can be measured with nitrate-sensitive colorimetric test papers [N14, N15]. More detailed instructions can be found here.
Several studies carried out in commercial fields in the Salinas Valley found that no fertilizer N is necessary when the pre-sidedress nitrate-N level in the soil is above 20 mg/kg (= 20 ppm) [N3, N5, N10, N15]. A concentration of 20 ppm nitrate-N in the top foot of soil equals approximately 80 lbs N/acre. In the absence of leaching, this amount of N could supply a crop for at least 2 weeks, even at peak N demand [N12]. If the nitrate-N concentration in the soil is below 20 ppm, only enough N to increase soil available nitrate-N to 20 ppm is needed (see Sidedress N). Contact your local farm advisor for more information.
Close
Leaf Analysis N
The nutrient concentration is determined in the youngest wrapper leaf. A minimum of 20 leaves should be collected, each from a different healthy plant of representative vigor [N12]. Samples are taken from the entire field. Variable fields should be divided into uniform blocks, which are sampled separately [N12]. It is important to accurately determine the crop growth stage since the total N concentration declines as crops develop. Once tissue samples are collected, they should be dried as quickly as possible [N12]. For more information on sampling procedure see Plant Tissue Sampling.
Hartz and coworkers [N16] developed optimum leaf nutrient ranges for iceberg and romaine lettuce based on a survey of 78 commercial fields in the coastal valleys of central California (see Table). The optimum nutrient concentrations can be considered sufficient for high-yield production. As the values were obtained from fields with generally high N and P inputs, values below the optimum range for these two nutrients may not limit yield [N16]. Contact your local farm advisor for more information. Optimum N, P and K concentrations of whole leaf samples [N16].
| Sampling date |
Nutrient Concentration (%) |
| |
N |
P |
K |
| Early heading |
4.3-5.6 |
0.45-0.75 |
3.3-6.4 |
| Pre-harvest |
3.3-4.8 |
0.35-0.75 |
2.9-7.8 |
Compared to the values presented in the table, earlier work suggested slightly lower optimum N levels of 3.0-4.0% at early heading and 2.5-3.0% pre-harvest [N6].
Whole leaf total N can be used to determine whether N availability has been adequate to date. Leaf N concentrations below the sufficiency level suggest that soil N availability may be limited and fertilization may be beneficial [N12]. However, leaf N and midrib nitrate analyses are relatively insensitive indicators of excess soil N availability [N11, N12, N15, N25]. In addition, cultivar and field specific factors can confound the relationship between N availability and tissue N concentration [N11]. Therefore, sidedress N decisions should not be based solely on tissue analyses.
In a recent study, Bottoms and coworkers [N2] found that whole plant N was a robust measure of N sufficiency. Their study suggested a pre-heading critical threshold of 4% N.
Close
Preplant Nitrogen
Pre-plant N applied in fall at bed listing is highly susceptible to leaching below the root zone by winter rain [N27]. Stone [N31] found that lettuce receiving starter and sidedress N outperformed lettuce that received a broadcast N application before seedbed preparation [N31].
In addition, lettuce requires little N in the early phase of growth. Studies found that N uptake during the first month after planting represented no more than 20% of total uptake [N21, N27, N30]. The optimal pre-plant application rate depends on residual soil nitrate-N. When the residual nitrate-N concentration exceeds 20 ppm, no pre-plant N application is required. When the residual soil nitrate-N concentration is lower, a small application of 20-40 lbs/acre just before or at planting is sufficient to cover the early N needs. To ensure that N is available in the root zone of young plants, the irrigation management should be optimized to limit nitrate movement below the root zone.
High application rates not only increase the risk of N losses, but may also damage seedlings. Studies in the Imperial Valley showed that pre-plant or starter ammonium-N application exceeding 50-60 lbs/acre may damage seedlings resulting in uneven growth [N35].
Close
Starter Nitrogen
Lettuce requires little N in the early phase of growth. Studies found that N uptake during the first month after planting represented no more than 20% of total uptake [N21, N27, N30]. For this reason, large application rates before or at planting are not needed and only increase the risk of nitrate leaching below the root zone [N41].
The starter application rate depends on residual soil nitrate-N. When the residual nitrate-N concentration exceeds 20 ppm, no starter N application is required. When the residual soil nitrate-N concentration is lower and no pre-plant N has been added, about 20 lbs N/acre are applied at planting, while the rest is applied at sidedressing [N29, N34]. Contact your local farm advisor for more information. To ensure that N is available in the root zone of young plants, the irrigation management needs to be optimized to prevent nitrate movement below the root zone.
The fertilizer band is generally placed two inches below and two inches to the side of the seed row [N19, N22, N35].
At planting, nutrients are often applied in the form of an anti-crustant which contains P and sometimes N [N18]. The amount of nutrients applied with the anti-crustant needs to subtracted from the total fertilizer requirements.
Close
Sidedress Nitrogen
Between heading and harvest, N demand of lettuce is high, reaching 3-4 lbs N/acre per day [N13, N32, N33]. During this period, which is generally the last month before harvest, 70-80% of total N is taken up [N21, N30, N33, N41]. A sufficient N supply between heading and harvest is crucial for obtaining a high yield.
When leaching losses are minimized, the seasonal N application rates for lettuce should not exceed 150-180 lbs/acre for winter and spring production and 100-140 lbs/acre for summer and fall production. However, the required N rate depends on the residual soil nitrate content. Crops produced from late fall through early spring generally require more fertilizer N because the residual soil N content tends to be lower during this period compared to the summer months [N12].
Several studies carried out in commercial fields in the Salinas Valley found that when the pre-sidedress soil nitrate-N level is above 20 mg/kg (= 20 ppm), no fertilizer N is necessary [N2, N3, N5, N10, N15]. If the soil nitrate-N concentration is below 20 ppm, only enough N to increase soil available nitrate-N to 20 ppm is needed. Approximately 4 lbs N/acre need to be added to increase the soil nitrate level by 1 ppm [N15]. As an example, when the soil nitrate-N concentration is 15 ppm, 20 lbs N/acre (4 lbs x 5 ppm) are needed to increase the level to 20 ppm. This approach has been successfully used in iceberg and romaine lettuce [N3, N5, N10].
In addition to residual soil nitrate, nitrate in the irrigation water should be accounted for to reduce the amount of N fertilizer applied. Nitrogen mineralization from soil organic matter and crop residues also add available soil N. Net N mineralization is generally higher after broccoli or cauliflower than after lettuce [N12] (see Factors Affecting Soil Nitrate Concentrations in Spring). These factors are taken into account by CropManage, a web-based irrigation and N management software tool developed by Cahn and coworkers[N4]. CropManage can be accessed href="https://cropmanage.ucanr.edu/Home/">here.
Sidedress N should be applied at a distance of at least 2-3 inches from the plant to avoid root damage from high salt concentrations in the band. Even at this distance, root burn of young lettuce plants has been observed in soils with a high clay content [N28].
A number of studies have compared different N fertilizers, such as ammonium sulfate, calcium nitrate, urea, ammonium nitrate, and potassium nitrate. In general, the effect of N form on lettuce yield and quality has been found to be small [N1, N7, N8, N26, N40]. In one study, panelists rated the crunchiness of lettuce fertilized with calcium nitrate highest [N26]. This effect was most likely the result of the increased calcium supply [N24] and may be minimal in Salinas Valley soils where calcium availablity is generally adequate [N17].
High application rates of ammonium fertilizers may cause root damage. Symptoms of root damage are generally more pronounced in cold, waterlogged soils [N9]. Plants suffering from ammonia toxicity wilt during the day. The older leaves may turn yellow and die. The central core of the taproot first turns yellow, then brown and finally dark brown to red [N23].
When the pre-sidedress soil nitrate-N concentration is below 20 ppm, the first sidedress N application is done after thinning at the two- to four-leaf-stage. If the residual nitrate-N concentration drops below 20 ppm, a second application is done 2-4 weeks later at the cupping stage [N3, N15].
Some growers apply 10-15 lbs N/acre 7 to 10 days prior to harvest to assure that the crop color and growth rate are optimal [N29, N34]. The decision whether to apply late-season N should also depend on the residual nitrate-N level. Furthermore, in sprinkler or furrow-irrigated fields the uniformity of such applications is typically poor and the danger of loss to the environment in runoff is high. For these irrigation methods, late-season, water-run applications should be avoided [N36]. For more information contact your local farm advisor.
|
Close
Lettuce Phosphorus Nutrition
Deficiency Symptoms
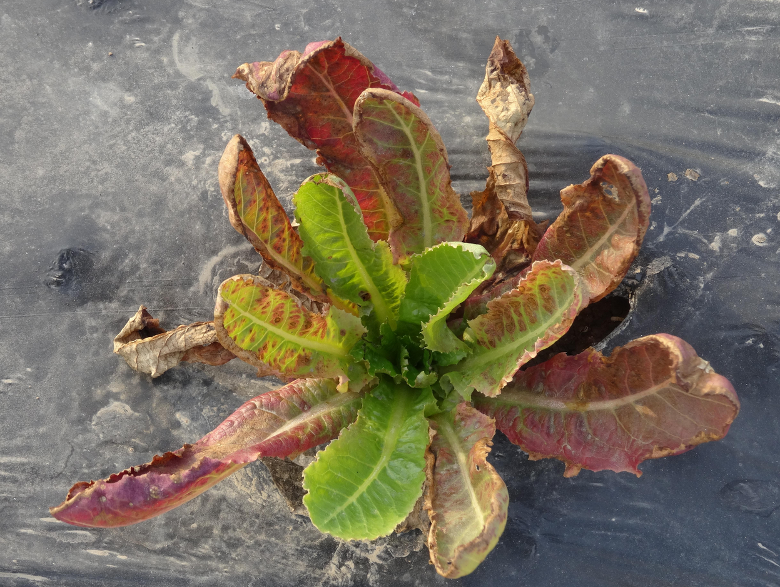
Early symptoms of P deficiency include a dull green appearance of the plant. Phosphorus deficiency results in reduced plant growth and leaf size. Symptoms may also include irregular, necrotic spots along leaf margins and purple to red pigmentation of leaf margins and stems. As P is mobile in the plant, symptoms first appear in older leaves [P16, P17].
Purpel color of older leaves is a sign of P deficiency. (photo provided by the International Plant Nutrition Institute).
Excessive Phosphorus
Application of moderate rates of N and P enhanced postharvest quality. However, high P and N application rates increase the sugar content, which can increase the severity of bacterial diseases and reduces the shelf life of lettuce [P5].
Close
Soil Analysis
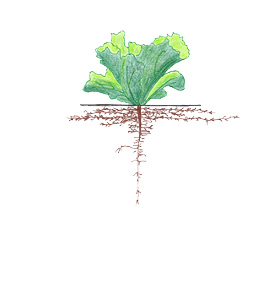
In lettuce, soil samples for P analyses are generally taken from the top foot of the profile, which is the major rooting zone [P15]. In a field experiment, Murakami and coworkers [P10] found approximately 80% of the root length in the top foot of the profile at harvest. In a field study in the Salinas Valley, Jackson and coworkers [P7] reported much lower loot densities below a depth of 6 inches compared to the topsoil. Even though some roots may reach a depth of 18 inches or lower, the root system of lettuce is considered shallow [P6, P7].
Soil samples can be taken in fall or spring (see Soil Test Sampling for sampling instructions).
Phosphorus availability is generally determined by extracting soil samples with a bicarbonate solution (Olsen-P). In a study carried out at different sites in the Salinas Valley, Johnstone and coworkers [P8] showed that bicarbonate extractable P is an accurate reflection of available P in neutral to alkaline soils. Little is known about the accuracy of the Olsen soil P test for lettuce production in soils with a pH below 6.2.
Bicarbonate extractable P concentrations above 60 ppm are considered high (see Table). In these soils, a yield response to P fertilizer is unlikely [P8, P15]. At intermediate P levels, small starter application rates may have a positive effect, especially in winter and spring when soil temperature is low (see Starter P). Higher application rates may be necessary for fields with low P availability (see Pre-plant P). Interpretation of P and K soil test levels in the top foot of the soil profile [P15].
| Soil test interpretation |
Phosphorus (Bicarbonate extraction) |
Potassium (Ammonium acetate extraction |
| Low |
< 40 ppm |
< 100 ppm |
| Medium |
40-60 ppm |
100-150 ppm |
| High |
> 60 ppm |
> 150 ppm |
Close
Leaf Analysis
The nutrient concentration is determined in the youngest wrapper leaf. A minimum of 20 leaves should be collected, each from a different healthy plant of representative vigor [P3]. Samples are taken from the entire field. Fields exhibiting spatially variable soil properties or yield should be divided into uniform blocks, which are sampled separately [P3]. It is important to accurately determine the crop growth stage since total P concentration declines as lettuce develops. Once tissue samples are collected they should be dried as quickly as possible [P3]. For more information on sampling procedure see Plant Tissue Sampling.
Hartz and coworkers [P4] developed optimum leaf nutrient ranges for iceberg and romaine lettuce based on a survey of 78 commercial fields in the coastal valleys of central California (see Table). The optimum nutrient concentrations can be considered sufficient for high-yield production. As the values were obtained from fields with generally high N and P inputs, values below the optimum range for these two nutrients may not limit yield [P4]. For more information contact your local farm advisor. Optimum N, P and K concentrations of whole leaf samples [P4].
| Sampling date |
Nutrient Concentration (%) |
| |
N |
P |
K |
| Early heading |
4.3-5.6 |
0.45-0.75 |
3.3-6.4 |
| Pre-harvest |
3.3-4.8 |
0.35-0.75 |
2.9-7.8 |
Earlier work suggested similar optimum P levels of 0.4-0.85% at early heading and 0.35-0.8% pre-harvest [P1]. For midrib samples, a sufficiency level of 0.25% P appears appropriate [P8].
Due to the short growth cycle of lettuce, tissue P analyses are more valuable as a planning tool for succeeding crops than as a management tool for the current crop [P8].
Close
Preplant Phosphorus
Phosphorus application rates should be based on soil test results. When large amounts are needed, P is commonly applied pre-plant, while smaller quantities are best applied as starter.
Up to 90 lbs P/acre (200 lbs P2O5/acre) may be needed to maximize lettuce growth in soils with a bicarbonate extractable P level below 10 ppm, especially when lettuce is planted during the winter and spring when the soil temperature is below 60 °F [P15]. Fields with soil test P levels between 30 and 40 ppm should not require more than 45 lbs P/acre (100 lbs P2O5/acre)[P15]. For more information contact your local farm advisor.
When soil test P levels are above 40 ppm, only small amounts of P are required which are best applied as starter (see Starter P).
In general, band applications are more effective than broadcast applications [P11, P12].
The fertilizer band is generally placed some two inches below and two inches to the side of the seed row [P5, P9, P14]. Especially fertilizers with a high nutrient concentration, e.g. 10-34-0 or 11-52-0, need to be banded at a safe distance to the developing plants. These fertilizers can inhibit seedlings because of the concentrated salts they contain [P15].
Broadcast P fertilizer needs to be disked into the soil because P is immobile in the soil. Leaving P on the surface results in lower uptake because the surface soil periodically dries out, which reduces the root density near the soil surface.
Phosphoric acid-based fertilizers are commonly used as anti-crustants. At normal use rates, these fertilizers do not damage the developing seedlings and can be an efficient way to provide a substantial proportion of the P required by lettuce plants[P15].
A number of granular and liquid P fertilizers are available. At high application rates, blends containing ammonium, such as ammonium phosphate (11-48-0), may damage seedlings [P14]. Fact sheets of the most common fertilizers can be found on the web site of the International Plant Nutrition Institute.
Close
Starter Phosphorus
Phosphorus application rates should be based on soil test results. The need for P fertilizer further depends on soil temperature, as cool soil temperatures decrease P availability [P2, P8]. Phosphorus applied with an anti-crustant needs to be subtracted from the total P fertilizer requirement.
For lettuce planted in winter or spring, a low starter application of 20 lbs P2O5/acre (9 lbs P/acre) may be most appropriate when soil test levels are between 40 and 55-60 ppm [P12, P13]. This application rate corresponds to the amount of P removed with marketable heads [P8].
For summer production, the threshold at which P fertilization is beneficial is approximately 40 ppm [P8]. For more information contact your local farm advisor.
Banding P fertilizer some two inches below and two inches to the side of the seed row generally provides the best results [P5, P9, P14].
|
Close
Lettuce Potassium Nutrition
Deficiency Symptoms
Leaves of K deficient plants are dark green. Older leaves have marginal and interveinal scorch (spots of dead tissue) [K14]. Since K is mobile in the plant, deficiency symptoms appear first on the oldest leaves.
Excessive Potassium
Potassium application rates far in excess of plant demand may interfere with magnesium uptake [K7].
Close
Soil Analysis
In lettuce, soil samples for K analyses are generally taken from the top foot of the profile, which is the major rooting zone [K12]. In a field experiment, Murakami and coworkers [K10] found approximately 80% of the root length in the top foot of the soil profile at harvest. In a field study in the Salinas Valley, Jackson and coworkers [K9] reported much lower root densities below a depth of 6 inches compared to the top 6 inches. Even though some roots may reach a depth of 18 inches or lower, the root system of lettuce is considered shallow [K8, K9].
Soil samples can be taken in fall or spring (see Soil Test Sampling for sampling instructions).
To determine the plant available K, soil samples are most often extracted with an ammonium acetate solution.
With soil K test values above 150 ppm, K fertilization is not required as lettuce is unlikely to respond (see Table) [K12]. With an intermediate K availability of 100 to 150 ppm, a yield response is possible. However, in a study carried out in Salinas, a K application rate of 60 lbs/acre did not significantly affect yield in a soil with K test values of approximately 100-120 ppm [K4]. With intermediate soil test values, the tissue analysis may indicate whether K fertilization may be beneficial. Lettuce grown in a field with a low soil K test value will likely respond to K fertilization. For more information contact your local farm advisor. Interpretation of P and K soil test levels in the top foot of the soil profile [K12] .
| Soil test interpretation |
Phosphorus (Bicarbonate extraction) |
Potassium (Ammonium acetate extraction |
| Low |
< 40 ppm |
< 100 ppm |
| Medium |
40-60 ppm |
100-150 ppm |
| High |
> 60 ppm |
> 150 ppm |
Close
Leaf Analysis
The nutrient concentration is determined in the youngest wrapper leaf. A minimum of 20 leaves should be collected, each from a different healthy plant of representative vigor [K2]. Samples are taken from the entire field. Fields exhibiting spatially variable soil properties or yield should be divided into uniform blocks, which are sampled separately [K2]. It is important to accurately determine the crop growth stage since total K concentrations change as crops develop. Once tissue samples are collected they should be dried as quickly as possible [K2]. For more information on sampling procedure see Plant Tissue Sampling.
Hartz and coworkers [K3] developed optimum leaf nutrient ranges for iceberg and romaine lettuce based on a survey of 78 commercial fields in the coastal valleys of central California (see Table). The optimum nutrient concentrations can be considered sufficient for high-yield production [K3]. Optimum N, P and K concentrations of whole leaf samples [K3].
| Sampling date |
Nutrient Concentration (%) |
| |
N |
P |
K |
| Early heading |
4.3-5.6 |
0.45-0.75 |
3.3-6.4 |
| Pre-harvest |
3.3-4.8 |
0.35-0.75 |
2.9-7.8 |
Earlier work suggested similar optimum K levels of 3.0-4.0% at early heading and 3.0-5.0% pre-harvest [K1].
Close
Preplant K / K Fertigation
The K application rate should be based on soil test results and leaf analyses. With soil K test values above 150 ppm, K fertilization is not required as lettuce will likely not respond to K fertilization.
With an intermediate K availability (100-150 ppm), a positive yield response is possible. When the leaf analysis indicates that K availability is low, applying the amount of K removed with harvested lettuce should be adequate. Between 60 and 90 lbs K/acre (70 -110 lbs K2O /acre) are removed with the harvested lettuce, assuming a yield of 350-400 cwt/acre [K13], a K concentration in the dry matter of the leaves ranging from 3.5 to 4.3% [K4, K11] , and a moisture content of 95% [K5].
In fields with low K soil test values, the application rate may be increased, especially when leaf analyses indicate that K supply is insufficient. A higher application rate may also be necessary in very sandy soils where K leaching may reduce the amount of available K. For more information contact your local farm advisor.
Potassium fertilizers are most commonly applied pre-plant. Pre-plant applications can be broadcast and incorporated into the soil or banded.
In drip irrigated fields, K can also be fertigated during the growing season. As is the case with N, lettuce takes up most of the K during the second half of its growth cycle [K11].
In hydroponically grown lettuce, Inthichack and coworkers[ K7] did not find a significant difference in yield between KCl and K2SO4 at application rates needed to maximize yields.
Lettuce fertilized with K2SO4 was found to be more prone to tipburn than plants fertilized with KCl; however, this was only evident at application rates exceeding the rates needed to obtain maximum yield [K7].
For fertigation, KCl is generally preferred over K2SO4 due to its higher solubility [K6].
|