Cauliflower Nitrogen Uptake and Partitioning
The Fertilization guidelines can also be found on the UC Davis Nutrient Management website .
Seasonal N Uptake
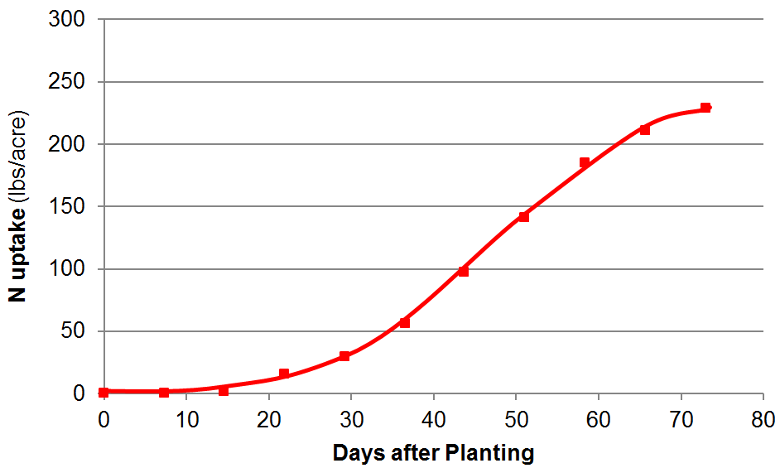
The N uptake curve is based on data from eight summer-planted commercial cauliflower fields in the Salinas Valley [3].
Nitrogen Partitioning
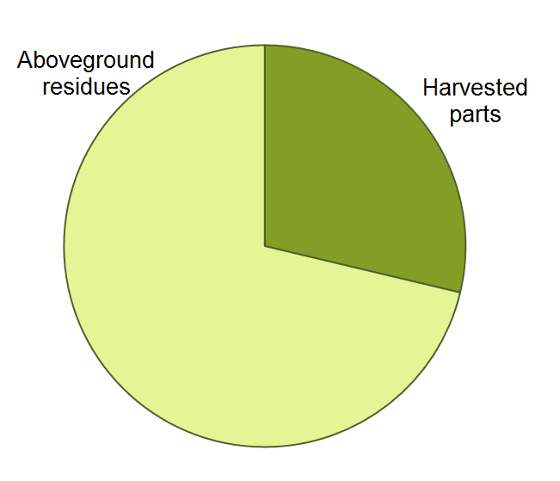
Less than one third of the total aboveground N is removed with the harvested parts [1,2].
Nitrogen Removed at Harvest
Cauliflower yield and N removed at harvest from different studies.
| Study location | Years | Marketable yield | N application rate | Aboveground N | Harvested N | Source | |
|---|---|---|---|---|---|---|---|
| (lbs/acre) | (cwt/acre) | (lbs/acre) | (lbs/acre) | (lbs/acre) | |||
| Central Coast | 2012-13 | 17,577 | 160 | 306 | 277 | 60 | [2] |
| Germany | 1996-97 | — | — | 270 | 264 | 95 | [1] |
Links
References
- Kage H., Alt C., Stuetzel, H., 2003. Aspects of nitrogen use efficiency of cauliflower II. Productivity and nitrogen partitioning as influenced by N supply. Journal of Agricultural Science 141, 17-29.
- Smith, R., Cahn, M., Hartz, T.K., 2013. Survey of nitrogen uptake and applied irrigation water in broccoli, cauliflower and cabbage production in the Salinas Valley. CDFA FREP Proceedings 89, 117-119.
- Smith, R., Cahn, M., Hartz, T., Love, P., Farrara, B., 2016. Nitrogen dynamics of cole crop production: implications for fertility management and environmental protection. HortScience 51, 1586-1591.