
Tomato Nitrogen Uptake and Partitioning
The Fertilization guidelines can also be found on the UC Davis Nutrient Management website .
Seasonal N Uptake
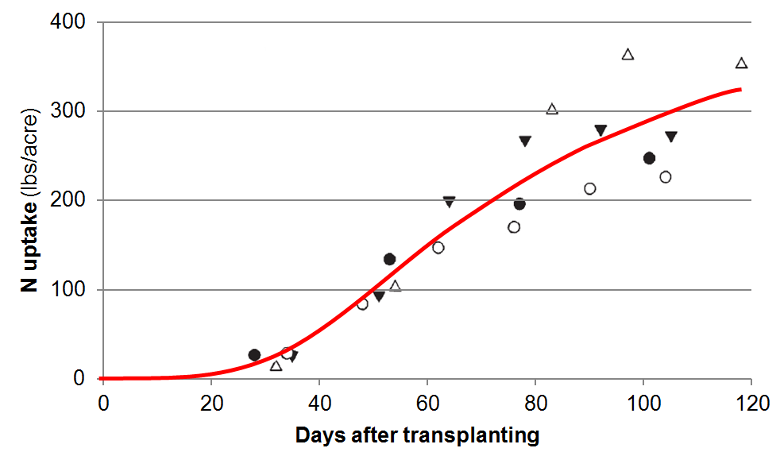
Nitrogen uptake curve of processing tomatoes grown in research plots at UC Davis and in commercial fields. Uptake was determined by harvesting the aboveground biomass at different times during the season [3]. Early in the season, N uptake was low. The period of low uptake is shorter with transplants compared to seeds. The N uptake remained relatively high until harvest.
Nitrogen Partitioning
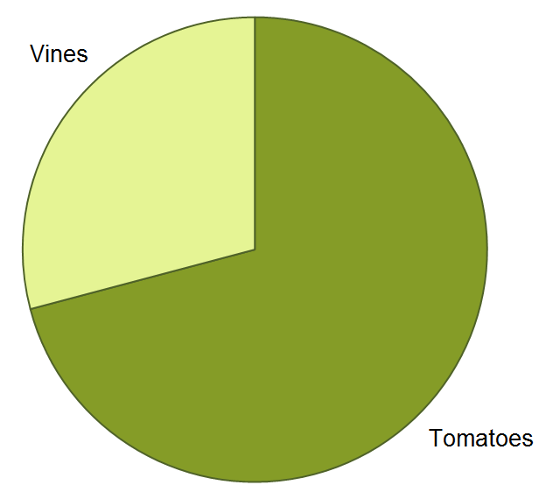
Approximately 70% of the total aboveground N was in tomatoes, with the rest being in the vines [3].
Nitrogen Removed at Harvest
Nitrogen removed at harvest of processing tomatoes. The overall average is weighted for the number of observations in each trial. More information can be found here href="#References">[2].
| Location | Years | Removal (lbs N/ton fresh weight) | Source | |
|---|---|---|---|---|
| Mean | Range | |||
| Central Valley, CA | 2007-2008 | 3.00 | 2.6-3.3 | [3] |
| Central Valley, CA | 2015 | 3.12 | 2.8-3.6 | [1] |
| Central Valley, CA | 2013 | 2.52 | 1.9-3.1 | [4] |
| Weighted Average | 2.73 | 1.9-3.6 | ||
Links
References
- Aegerter, B., 2015. Potential for improved fertigation efficiency via field-based sensing devices. Report submitted to the California Tomato Research Institute. Complemented with unpublished data.
- Geisseler, D., 2016. Nitrogen concentrations in harvested plant parts -A literature overview. Report to the Kings River Watershed Coalition.
- Hartz, T.K., Bottoms, T.G., 2009. Nitrogen Requirements of Drip-irrigated Processing Tomatoes. HortScience 44, 1988-1993.
- Lazcano, C., Wade, J., Horwath, W.R., Burger, M., 2015. Soil sampling protocol reliably estimates preplant NO3- in SDI tomatoes. California Agriculture 69, 222-229.