Silage Corn Nitrogen Uptake and Partitioning
The Fertilization guidelines can also be found on the UC Davis Nutrient Management website .
Seasonal N Uptake
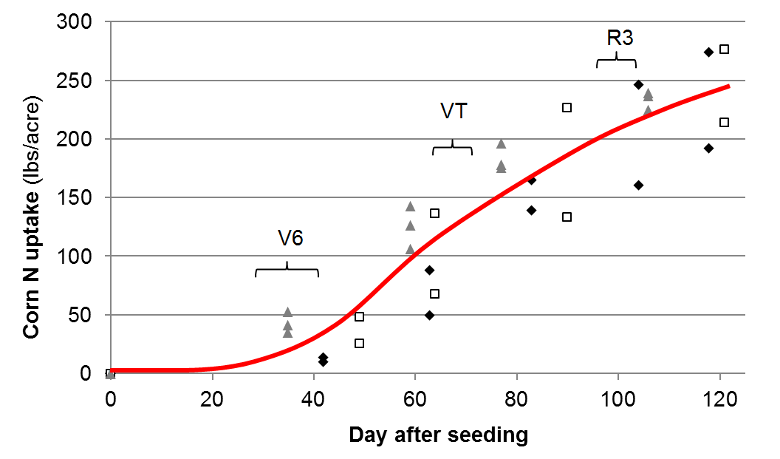
Nitrogen uptake curve of silage corn grown on three dairies in the Modesto area. Uptake was determined by harvesting the aboveground biomass at different times during corn development. Corn plants took up little N until they reached the 6-leaf stage (V6). Between the 6-leaf and the milk stage (R3), however, N uptake rates were high. When corn reached the tasseling stage (VT), it had taken up 60% or more of the total N. [2].
Nitrogen Partitioning
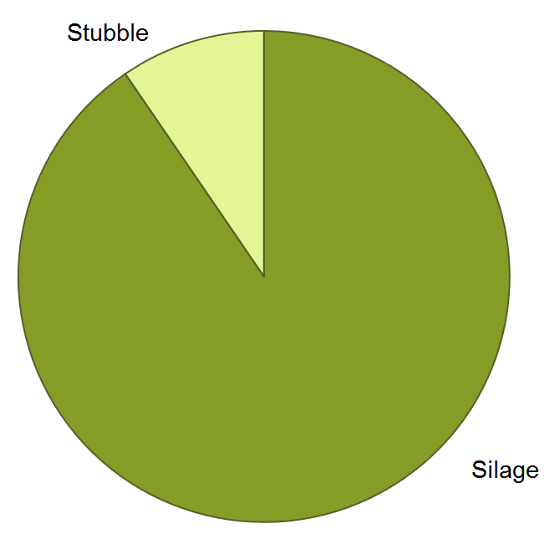
Almost the entire aboveground biomass is removed when silage corn is harvested. We estimated that less than 10% of the aboveground N is left in the field with the stubble.
Nitrogen Removed at Harvest
Nitrogen removed with harvested Silage Corns. More information can be found here href="#References">[2].
| Location | Years | Removal (lbs N/ton @ 70% moisture) | Source | |
|---|---|---|---|---|
| Mean | Range | |||
| California | 2014 | 7.39 | 6 - 8.4 | [3] |
| California | 1997-2011 | 7.62 | 5 - 10.4 | [4] |
| Weighted Average | 7.56 | 5 - 10.4 | ||
Links
References
- Geisseler, D., 2016. Nitrogen concentrations in harvested plant parts -A literature overview. Report to the Kings River Watershed Coalition.
- Geisseler, D., Lazicki, P.A., Pettygrove, G.S., Ludwig, B., Bachand, P.A.M., Horwath, W.R., 2012. Nitrogen dynamics in irrigated forage systems fertilized with liquid dairy manure. Agronomy Journal 104, 897-907.
- Heguy, J., Silva-del-Rio, N., 2014. 2014 Corn Silage Audit.
- Robinson, P., 2011. Assays of individual samples of California feedstuffs.