
Celery Nitrogen Uptake and Partitioning
The Fertilization guidelines can also be found on the UC Davis Nutrient Management website .
Seasonal N Uptake
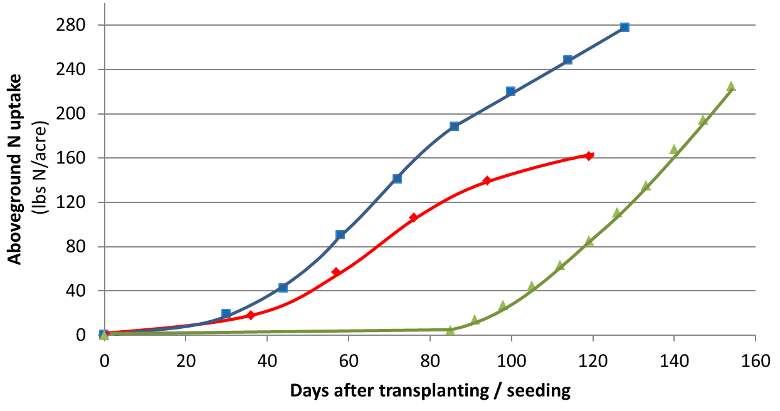
Aboveground seasonal N uptake from drip-irrigated celery grown in Santa Ana, California (red line) and the coast of Spain (blue line), and direct-seeded, furrow irrigated celery in Salinas (green line). Yields were between 500-1000 cwt/acre. For transplanted celery, uptake is slow for about 45 days after transplanting. Uptake normally increases steadily until harvest [1,2,3].
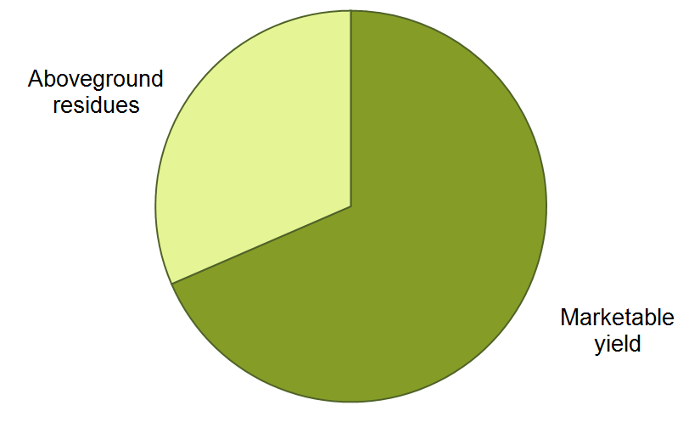
Nitrogen Removed at Harvest
Nitrogen removed with harvested celery.
| Location | Year | Yield | Removal in harvest | Source | |
|---|---|---|---|---|---|
| (cwt/acre) | (lbs N/acre) | (lbs N/100 cwt) | |||
| Salinas, CA | 1960s | 1041 | 280 | 27 | [3] |
| Santa Ana, CA | 1980 | 581 | 162 | 28 | [1] |
| Cartagena, Spain | 1998 | not given | 278 | [2] | |
Links
References
- Feigin, A., Letey, J., Jarrell, W.M., 1982. Celery response to type, amount, and method of N-fertilizer application under drip irrigation. Agronomy Journal 74, 971-977.
- Rincón-Sánchez, L., Pellicer Botía, C., Sáez Sironi, J., Pérez Crespo, A., Abadía Sánchez, A., 2002. Crecimiento vegetivo y absorción de nutrientes del apio en fertirrigación.
- Zink, F.W., 1966. Celery growth and nutrient absorption studies. California Agriculture 20 (7), 10-10.